ONS-CIS
This work contains statistical data from ONS, which is Crown Copyright. The use of the ONS statistical data in this work does not imply the endorsement of the ONS in relation to the interpretation or analysis of the statistical data. This work uses research datasets that may not exactly reproduce National Statistics aggregates.
The ONS-CIS is a UK household-based surveillance study in which participant households are approached at random from address lists across the country to provide a representative sample of the population21. All versions of the study protocol are available at https://www.ndm.ox.ac.uk/covid-19/covid-19-infection-survey/protocol-and-information-sheets. All individuals 2 years of age and older from each household who provide written informed consent provide swab samples (taken by the participant or parent or carer for those under 12 years of age), regardless of symptoms, and complete a questionnaire at assessments. The survey offered participants the option of only having one enrolment assessment (taken by approximately 1%), or weekly assessments for only 1 month (taken by approximately 1%; Extended Data Fig. 1). All other enrolled participants (approximately 98%) were assessed weekly for the first month of their enrolment in the survey and then approximately monthly (originally for 1 year; all such participants were approached for re-consent for ongoing follow-up beyond 1 year). The survey had rolling recruitment to meet its target for taking a certain number of swabs from the population each month, but in practice, most recruitments occurred between September and December 2020 (Supplementary Information; also see supplementary table 4 in ref. 50). The rolling recruitment enabled the study to achieve its overall sample numbers (required to address its surveillance objectives) while accounting for participants withdrawing from the study. As is standard, the protocol also allowed a 14-day window around the approximately monthly assessments (shifting any following assessments to avoid swabbing participants again at very short (and variable) notice); crucially, assessments were not missed to meet survey targets.
As the vast majority of recruitment comes from invitations sent to households randomly selected from address lists that we do not have relevant demographic information, we are not able to compare characteristics of those agreeing and not agreeing to participate. From 26 April 2020 to 31 July 2022, assessments were conducted by study workers visiting each household; from 14 July 2022 onwards, assessments were remote, with swabs taken using kits posted to participants and returned by post or courier, and questionnaires completed online or by telephone. For this analysis, we included data from 2 November 2020 to 15 August 2022, spanning a period from Alpha to Omicron BA.2 sequences within the ONS-CIS dataset (Extended Data Table 1).
To date, of 535,731 participants recruited into the ONS-CIS, 109,417 (20%) have either completed their participation after a single enrolment visit, visits only for the first month or only for the first year (7%) or withdrawn (13%; see Supplementary Information). Moving house was a major reason for completing participation in the survey (as this leads to participants no longer being eligible for follow-up as it is the original address that is sampled), a small number of participants died (0.4%), and in July 2022, the survey moved to a remote data collection approach at which point some participants chose to end their participation. For the time period of this study, 96.2% of swabs had a negative result and 1.9% had a positive result (1.9% were void). For those with positive test results, the mean time since the previous assessment was 35.2 days and to the next assessment was 37.1 days. For those with a negative test, the associated numbers were 31.8 days and 33.0 days. By definition, 100% of first positive samples from each persistent infection had a subsequent assessment. There was no statistical difference in the time between sampling for individuals with persistent infection compared with those testing positive (Supplementary Information).
Sequencing
From December 2020 onwards, sequencing was attempted on all positive samples with Ctââ¤â30; before this date, sequencing was attempted in real time wherever possible, with some additional retrospective sequencing of stored samples. The vast majority of samples were sequenced on Illumina Novaseq, with a small number using Oxford Nanopore GridION or MINION. One of two protocols were used: the ARTIC amplicon protocol51 with consensus FASTA sequence files generated using the ARTIC nextflow processing pipeline (v1)52, or veSeq, an RNA sequencing protocol based on a quantitative targeted enrichment strategy19,53 with consensus sequences produced using shiver (v1.5.8)54. During our study period, we identified 94,943 individuals with a single sequence and 5,774 individuals with two or more sequences. Here we only included sequences with 50% or more genome coverage.
Identifying candidate persistent infections
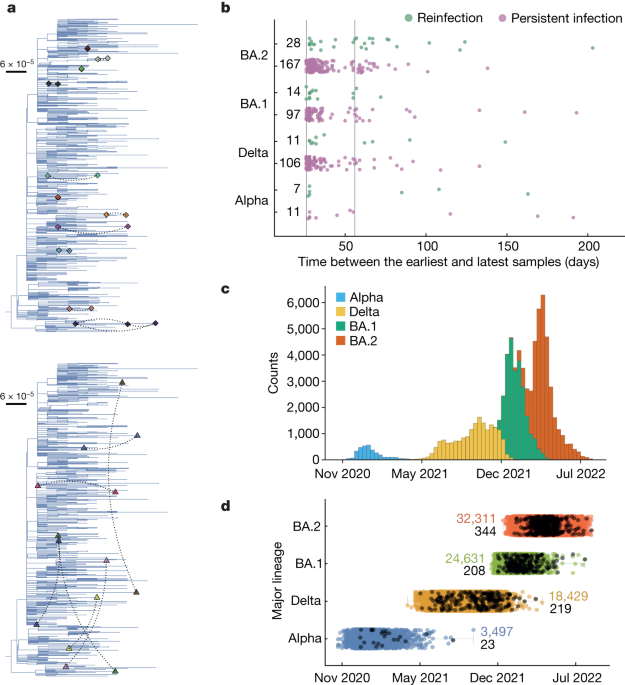
We first identified individuals with two or more sequenced samples taken at least 26 days apart. We chose this cut-off because the majority of individuals with acute infection shed the virus for less than 20 days and no longer than 30 days in the respiratory tract24,55. Given the extreme heterogeneity in the shedding profiles during some acute infections24,55, we also considered a more conservative 56-day cut-off for some analyses. Selection was based on availability of sequences, which were required for genetic analysis; it was not possible to allow for failure to identify any long-term shedding due to participants not having assessments/swabs or tests failing or subsequent positives having Ctâ>â30, and therefore not being sent for sequencing. However, this means that some persistent infections are likely to have been missed and so our estimates should be considered a lower bound.
Candidate persistent infections were defined in one of two ways: (1) pairs of sequenced samples that belonged to the same major lineage, and (2) pairs of sequenced samples where one or both had no defined phylogenetic lineage, but where the genetic distance between them was lower than that required to differentiate two major lineages (Extended Data Fig. 9). The major lineages that we considered were Alpha (B.1.1.7), Delta (B.1.617.2), Omicron BA.1 and Omicron BA.2, including their sublineages. We assumed pairs belonging to different major lineages were either co-infections or reinfections with two different virus lineages. Only candidate persistent infections were considered in further analysis.
Identifying persistent infections
We determined whether two sequences from the same individual are from the same infection by whether they share a rare SNP at two or more consecutive time points relative to the population-level consensus. If an intermediate sequence from that individual had an unknown nucleotide at a site (due to poor coverage), whereas the first and last sequences shared a rare SNP, then the intermediate sequence was also assumed to be part of the same infection. Rare SNPs were defined as those that were shared by fewer than a threshold number of sequences, belonging to each major lineage, within the full ONS-CIS dataset (Extended Data Fig. 2). The thresholds were chosen to maximize the number of persistent infections identified while minimizing the number of false positives (see below).
To determine the false-positive rate, for each major lineage, we generated a dataset of 1,000 randomly paired sequences from different individuals in the ONS-CIS, each sampled at least 26 days apart. We determined the proportion of these pairs that would have been incorrectly identified as persistent infections as a function of the threshold for determining whether a SNP is rare (Extended Data Fig. 2). Although the total number of persistent infections that we identified (among the list of candidate persistent infections) grew as the threshold for determining whether a SNP is rare increased, at very high thresholds, the rate of false positives (among the list of randomly paired sequences) was also high. In our study, we chose a threshold of 400 sequences (corresponding to all sequences of the same major lineage within the full ONS-CIS dataset) for all of the major lineages, giving a false-positive rate (identifying an infection as persistent when it was not) of 0â3%. Using this threshold, approximately 92â98% of all sequences from the four major lineages had a rare SNP relative to the major-lineage population-level consensus.
Identifying reinfections with the same major lineage
Any pair of sequences from the same individual, of the same major lineage and at least 26 days apart were considered as candidate reinfections. Of these, pairs that had at least one nucleotide difference at the consensus level, and did not share any rare SNPs, were classed as reinfections. Pairs that had no identical rare SNPs, nor any nucleotide differences at the consensus level, were classed as undetermined.
Sample mix-ups could inflate the true number of reinfections. In the ONS-CIS, each sample has a unique barcode, a small minority of barcodes are positive, and even fewer still have a Ctââ¤â30; therefore, random swapping of barcodes is unlikely to result in a wrong positive sample with Ctââ¤â30 being sent for sequencing. For each weekly sampling batch, we also checked concordance between lineage from the sequencing laboratory and S gene target failure from the testing laboratory; concordance between Ct from the testing laboratory and genome coverage from the sequencing laboratory (high coverage is expected for low Ct, and low coverage for high Ct); and for veSeq, a log-linear relationship between the number of mapped reads from the sequencing laboratory and Ct from the testing laboratory19.
Phylogenetic analysis
For each of the four major lineages, we chose 600 consensus sequences with at least 95% coverage from the ONS-CIS dataset using weighted random sampling, with each sample of major lineage i collected in week j given a weight 1/nij, where nij is the number of sequences of major lineage i collected during week j22. These sequences were added as a background set to the collection of all consensus sequences for samples from persistent infections and reinfections. Mapping of each sequence to the Wuhan-Hu-1 reference sequence was already performed by shiver, and thus a full alignment for each of the four lineages could be constructed using only this.
Maximum likelihood phylogenetic trees were constructed using IQ-TREE (v1.6.12)56 using the GTR+gamma substitution model and ultrafast bootstrap57. Each tree was rooted using the collection dates of the samples and the heuristic residual mean square algorithm in TempEst58. Visualization used ggtree59.
Measuring the number of independent appearances of mutations and their fitness effects
To find the frequency with which mutations (not including deletions) that we identified during persistent infections are represented in cross-sectional samples from the population and their between-host level fitness, we used the results from ref. 29 on the estimated number of appearances of mutations from a representative global dataset of approximately 6.5 million SARS-CoV-2 sequences (for number of appearances: https://github.com/jbloomlab/SARS2-mut-fitness/blob/main/results/mutation_counts/aggregated.csv; for estimating the fitness effect of mutations: https://github.com/jbloomlab/SARS2-mut-fitness/blob/main/results/aa_fitness/aamut_fitness_by_clade.csv), as well as a subset of those sequences that are only sampled from England (arguably more relevant to our sequences from the ONS-CIS). When doing this, we controlled for major lineage, meaning, for example, if a mutation occurred in a BA.1 persistent infection, we only considered the number of times it appeared on the BA.1 phylogeny. To map between Pangolin lineages and Nextstrain clades, we assumed B.1.1.7ââ¡â20I, B.1.617.2ââ¡â{21A,21I,21J}, BA.1ââ¡â21K and BA.2ââ¡â{21L,22C,22D}. We also compared the frequency and fitness effect of mutations that appeared in two persistent infections (that is, recurrent mutations) and those that appeared in only one persistent infection (that is, single mutations) as reported in ref. 29.
Estimating the percentage of infections that are persistent
We identified 381 and 54 infections that lasted 30 days or longer and 60 days or longer, respectively. Comparing this with the number of individuals that had sequenced samples belonging to Alpha, Delta, BA.1 or BA.2, we identified approximately 0.49% (381 of 77,561) and 0.07% (54 of 77,561) of infections with at least one sample that could be sequenced as persistent for 30 days or longer and 60 days or longer, respectively. As the ONS-CIS is a representative sample of individuals from the general population, we can estimate the percentage of all SARS-CoV-2 infections that became persistent for 1 month or longer, and that have intermittent high viral loads. To do this, we need to determine the probability that a persistent infection with one sequenced sample has at least one more sequenced sample. As most persistent infections probably last 1â3 months, and without knowing the true viral kinetics during persistent infection, this can be approximated as the probability that a persistent infection has virus that can be sequenced on any given day of sampling.
At one extreme, if a typical persistent infection has a virus sample that can be sequenced for only 4 days per month (assuming viral dynamics similar to one acute infection each month), only 14% of persistent infections would be detected through approximately monthly sampling. Correcting for this, we would estimate the percentage of detected infections that are persistent in the general population for 30 days or longer to be 3.5%, calculated as the ratio of the estimated prevalence of persistent infections (0.49%) to the detection rate (14%). Similarly, for infections persisting 60 days or longer, the estimated percentage would be 0.5% (0.07%/0.14). At the other extreme, if we assume typical persistent infections have sequenceable virus for 20 days per month and, therefore a detection rate of 71%, we would estimate the percentage of detected infections that are persistent infections in the general population for 30 days or longer to be 0.7% (0.49%/0.71) and for 60 days or longer to be 0.1% (0.07%/0.71).
Comparing viral load activities and symptoms
To quantify the changes in viral load activities during persistent infections, we compared Ct values at the last time point a sequence was obtained to when the first sequence was collected. Likewise, for reinfections, we compared the changes in Ct value between the primary infection and reinfection. We used a paired Studentâs t-test to calculate P values in both cases as the distribution of differences in Ct values were normally distributed for both persistent infections (Wâ=â0.99, Pâ=â0.28) and reinfections (Wâ=â0.99, Pâ=â0.78) as determined by the ShapiroâWilk test60.
We also tracked 12 symptoms consistently solicited from all participants at every assessment. Symptoms were fever, weakness/tiredness, diarrhoea, shortness of breath, headache, nausea/vomiting, sore throat, muscle ache, abdominal pain, cough, loss of smell and loss of taste. At each follow-up assessment, participants were asked whether these 12 symptoms had been present in the past 7 days (mandatory question completed at all assessments where a swab was taken). Symptom discontinuation was defined as the first occurrence of two successive follow-up visits without reporting symptoms. To compare symptom counts during persistent infections and reinfections, we used the two-sided paired Wilcoxon test as the distribution of symptom differences is not normally distributed (Fig. 3e). For calculation of P values and visualization of histograms and box plots, we used Mathematica (v13.1.0.0).
Long COVID analysis
Attributing persistent symptoms to a previous SARS-CoV-2 infection is difficult in the absence of a diagnostic test for long COVID, and long COVID cases are known to be under-recorded in electronic health records61. Long COVID status was therefore self-reported by study participants, so we cannot exclude some participantsâ symptoms being caused by a medical condition other than COVID-19. From February 2021, at every assessment, participants were asked âwould you describe yourself as having long COVID, that is, you are still experiencing symptoms more than 4 weeks after you first had COVID-19, that are not explained by something else?â.
When estimating long COVID prevalence in this analysis, we considered the first assessment at least 12 weeks and at least 26 weeks after infection. Our comparison group comprised all individuals with a positive PCR test and Ctââ¤â30 at the first positive test, excluding the individuals with persistent infection identified in this study, over the same time span as persistent infections such that first positive test was within the range of dates of the first positive test among the persistent infection group. Although the underlying study design for ONS-CIS is a cohort study, this specific analysis of long COVID focuses on comparing persistent to non-persistent infections in terms of the risk of subsequent self-reported long COVID (binary outcomes, at least 12 weeks and at least 26 weeks following the first positive test). Some missing data were inevitable, given the timeframe of the study and participant completion or withdrawal (see above); overall, the long COVID question was not completed at 368,161 of 6,797,789 (5.4%) of assessments during the study period from 4 February 2021 when it was introduced, with 93% and 86% of participants without persistent infection but with a positive test with Ctâ<â30 having a response to the long COVID question at least 12 and 26 weeks after infection, respectively (Extended Data Fig. 1). Analysis used complete cases, that is, excluded those who did not have a response to the long COVID question in this timeframe (Extended Data Fig. 1). As these are binary outcomes rather than a time-to-event outcome, either an odds ratio or a relative risk could be used to evaluate the risk of long COVID in individuals with persistent infection; here we used odds ratio. The fact that some persistent infections were probably missed due to sequencing only being attempted in high viral load samples and due to missed assessments means that our estimates of the impact of persistent infection are likely to be biased towards the null, that is, the true effects of persistent infection are probably larger than we estimate. Follow-up from the start of infection to first long COVID response was similar between persistent and non-persistent infections (Table 3).
In calculating the odds ratio of long COVID in individuals with persistent infection relative to the comparison group, we used a binary logistic regression model and accounted for confounding variables such as age at the last birthday, sex, Ct value, calendar date, area deprivation quintile group, presence of self-reported long-term health conditions (binary), vaccination status (unvaccinated or single vaccinated, fully vaccinated or booster vaccinated 14â89 days ago, fully vaccinated or booster vaccinated 90â179 days ago, fully vaccinated or booster vaccinated 180 or more days ago) and days from first positive test to long COVID follow-up response. All variables except the last one were defined at the time of the first positive test. Continuous variables (age, Ct value, calendar date and days to follow-up response) were modelled as restricted cubic splines with a single internal knot at the median of the distribution and boundary knots at the 5th and 95th percentiles. Vaccination status was derived from a combination of CIS and National Immunisation Management System (NIMS) data for participants in England, and CIS data alone for participants in Wales, Scotland and Northern Ireland. Given the number of potential confounders included, we did not test for interaction (effect modification). We did not test for goodness of fit because the model was solely used to control for measured confounders of the relationship between persistent positivity and long COVID, which we selected on substantive, rather than empirical, grounds (that is, using a causal inference approach).
Although we controlled for many confounders that could potentially impact our long COVID analysis, of note, age, sex, vaccination status and previous infection, there may still be unknown residual confounders that can influence our results. We were also unable to perform the long COVID analysis for the reinfection group due to the low number of participants in this cohort who reported new-onset long COVID 12 weeks or longer or 26 weeks or longer after infections.
Reporting summary
Further information on research design is available in the Nature Portfolio Reporting Summary linked to this article.

Sarah Carter is a health and wellness expert residing in the UK. With a background in healthcare, she offers evidence-based advice on fitness, nutrition, and mental well-being, promoting healthier living for readers.