
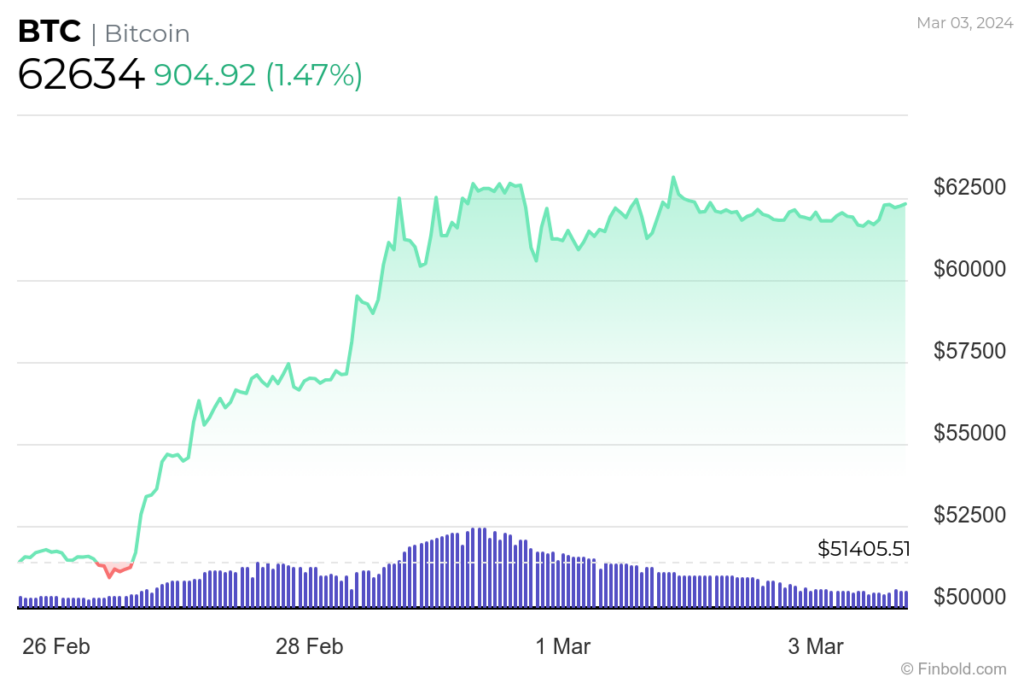
After experiencing consistent gains in recent days, the value of Bitcoin (BTC) seems to be consolidating above $60,000, a level that is also functioning as a support. However, uncertainty persists regarding the next direction for Bitcoin, as the asset failed to sustain its value above $64,000 after briefly touching it.
Looking ahead, crypto analyst Ali Martinez has presented a scenario that could result in Bitcoin dropping and finding potential support around the $50,000 zone.
In a post on X (formerly Twitter) on March 3, Martinez noted that more than 500,000 BTC had changed hands within the narrow range of $61,100 to $61,800, establishing a robust support area.
According to the analyst, if Bitcoin stays above $61,000, it could pave the way for a climb towards $65,900. However, a word of caution is warranted in a bearish turn. If Bitcoin dips below the established support, a correction could be triggered, potentially leading the digital asset to as low as $51,500.
“Should BTC dip below support, a correction could lead it down to $56,970 or even $51,500,” he said.
Indeed, the substantial transaction amount for BTC has occurred amid a growing demand for spot Bitcoin exchange-traded funds (ETF), with a peak volume of $73.91 billion on March 1. In the long term, this product is considered a bullish catalyst.
What next for Bitcoin?
The focus remains mainly on Bitcoin’s potential to reach another all-time high, supported by catalysts like the upcoming halving event. While $100,000 is the next possible target in 2024, Finbold reported that some analysts believe the halving alone might not be the sole key.
In this context, crypto trading expert Gareth Soloway suggested that the likelihood of Bitcoin reaching $100,000 will probably be bolstered by increasing liquidity in the market. However, he emphasized that Bitcoin remains susceptible to further corrections despite a positive long-term outlook.
Bitcoin price analysis
Bitcoin was trading at $62,634 by press time, having gained almost 1.5% in the last 24 hours. Over the past seven days, Bitcoin has rallied by nearly 20%.
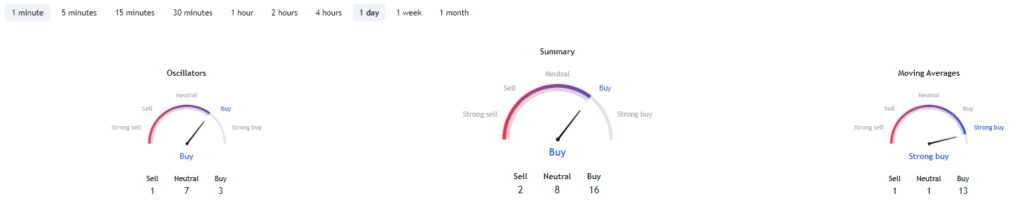
Despite the analyst’s possibility of a bearish outlook, Bitcoin’s technical indicators are dominated by bullish sentiments. For instance, a summary of the one-day gauges retrieved from TradingView suggests a ‘buy’ sentiment at 16, while moving averages indicate a ‘strong buy’ at 13. Oscillators recommend a ‘neutral’ stance at 8.
Although Bitcoin has displayed bullish sentiments recently, the threat of losing the $61,000 support persists. This risk is further elevated if factors such as increased whale selling come into play.
Disclaimer: The content on this site should not be considered investment advice. Investing is speculative. When investing, your capital is at risk.

Robert Johnson is a UK-based business writer specializing in finance and entrepreneurship. With an eye for market trends and a keen interest in the corporate world, he offers readers valuable insights into business developments.