
- BTC’s metrics suggested that selling pressure on the coin was low.
- Market indicators hinted at a few more less volatile days ahead.
Bitcoin [BTC] continues to underperform over the last few days as it fails to go above the $65k mark. In the meantime, a deep learning model predicted something interesting as it suggested that BTC’s price might reach new highs in just the next 30 days.
Bitcoin’s new ATH soon?
According to CoinMarketCap, the last seven days remained pretty dormant as BTC’s price only moved marginally. The same trend was also visible in its daily price action. At the time of writing, BTC was trading at $64,294.85 with a market capitalization of over $1.26 trillion.
While BTC’s price remained less volatile, CryptoOnChain, an author and analyst at CryptoQuant, posted an analysis highlighting a notable development. The analysis used a deep learning model that predicted BTC’s next 30-day price action.
The AI model has been trained based on 370 on-chain indicators to predict the price of Bitcoin in the next 30 days based on the data from the past year.
The analysis also included visualizations of actual price versus predicted price by the model for the training, validation, and test datasets.
If the prediction of the AI model is to be believed, then BTC’s price will gain bullish momentum after 25 days. The price uptrend would allow BTC to go above $77k, as per the AI model.
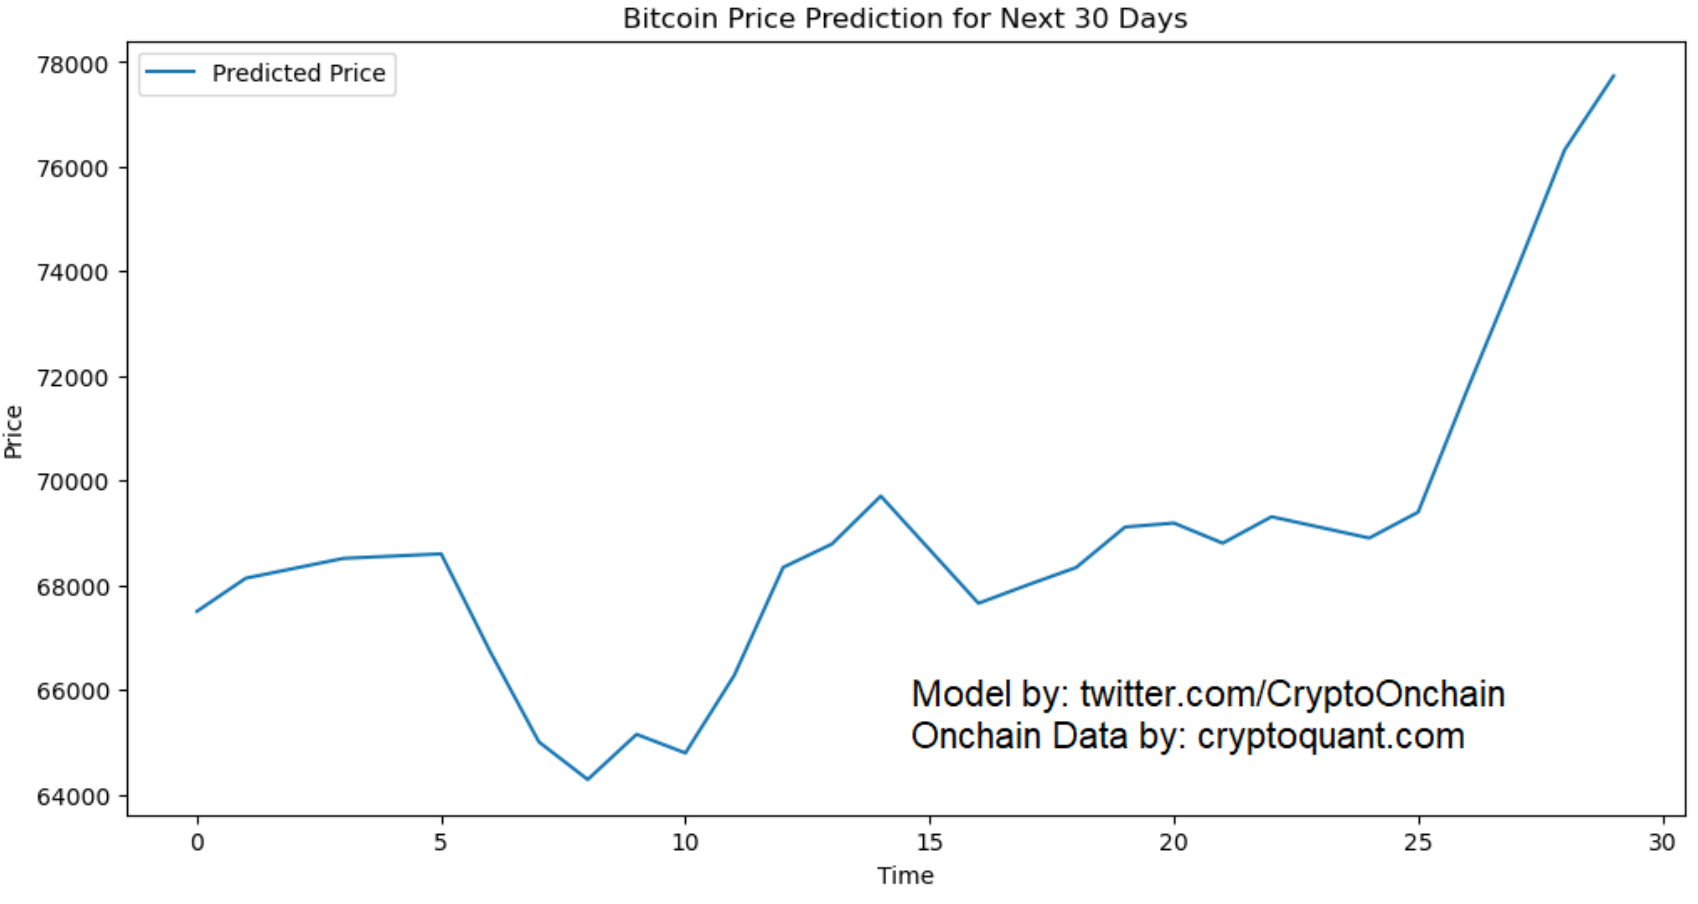
Source: CryptoQuant
What metrics suggest
Since the $77k target looked pretty ambitious, AMBCrypto checked BTC’s metrics to find out whether the king of cryptos is getting ready for a bull run.
We found that its network to value (NVT) ratio registered a sharp drop. A decline in the metric means that an asset is undervalued, indicating a possible price increase.

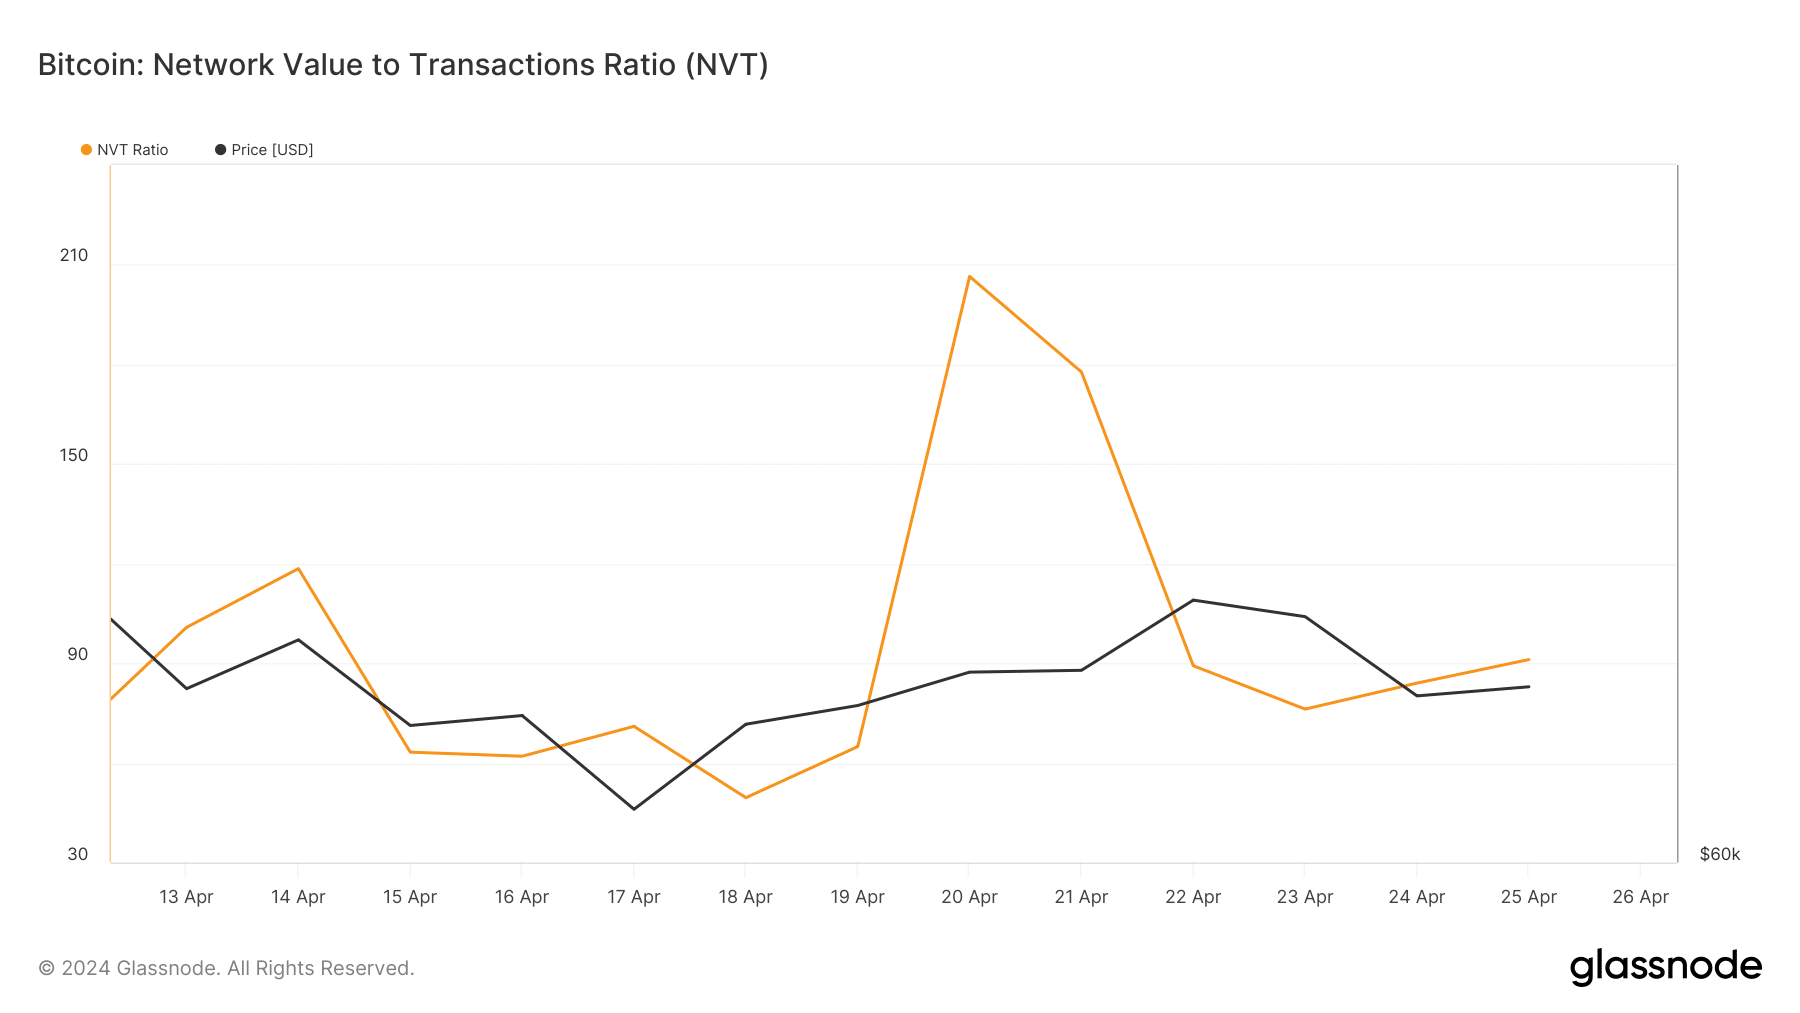
Source: Glassnode
Apart from these, quite a few other metrics also looked bullish on BTC. AMBCrypto’s analysis of CryptoQuant’s data revealed that BTC’s exchange reserve was dropping.
Its net deposit on exchanges was low compared to the last seven days’ average. These indicated that selling pressure on BTC was dropping.

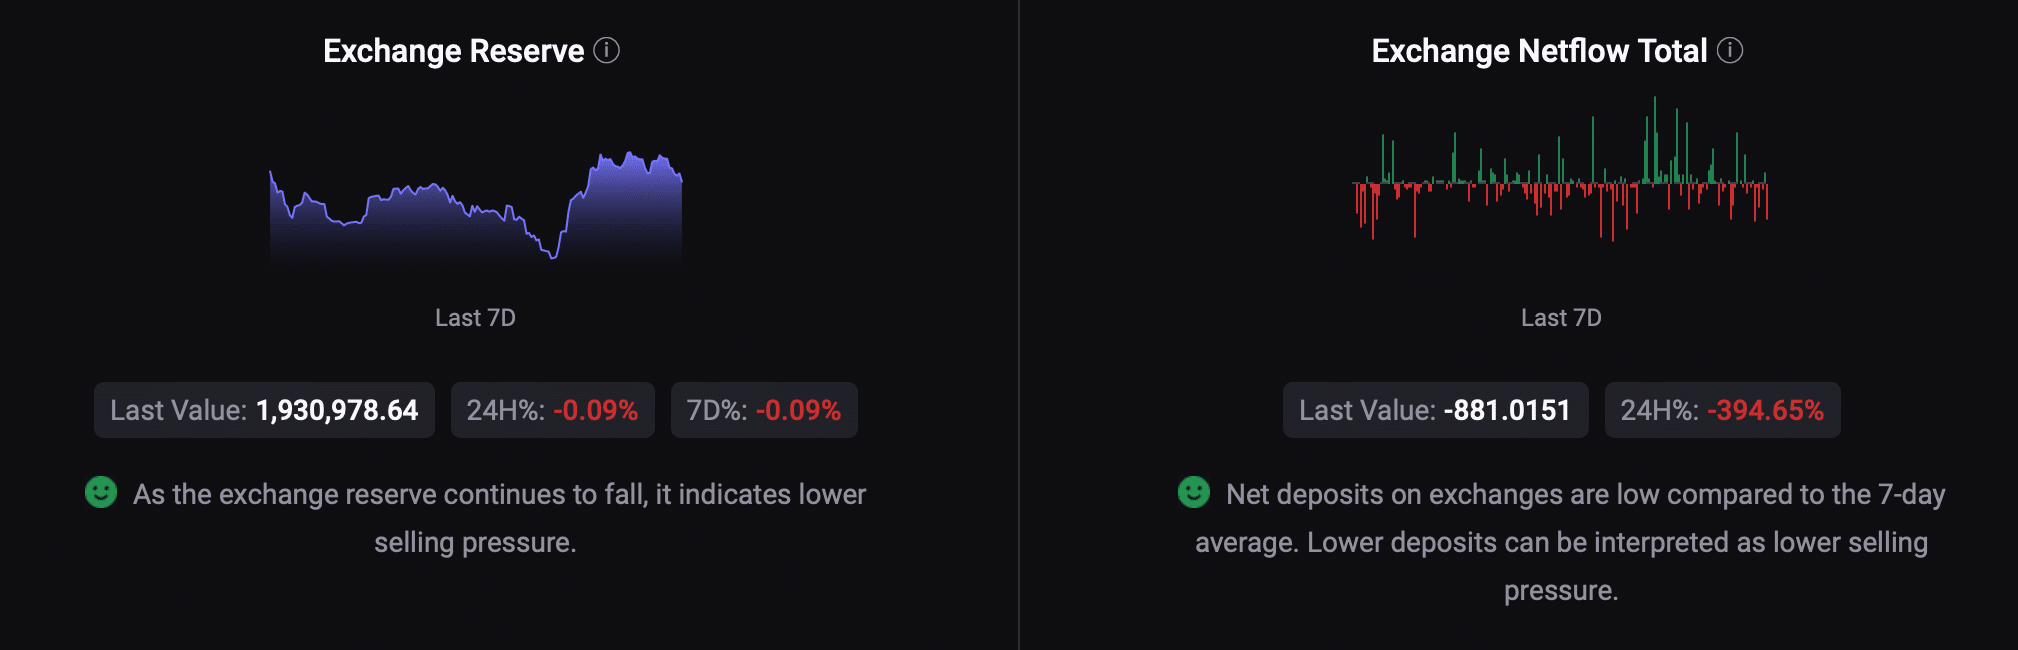
Source: CryptoQuant
Additionally, BTC’s binary CDD was green, meaning that long-term holders’ movements in the last 7 days were lower than average.
However, at press time, Bitcoin’s fear and greed index had a value of 70. This suggested that the market was in a “greed” phase, which can be troublesome in the short term.

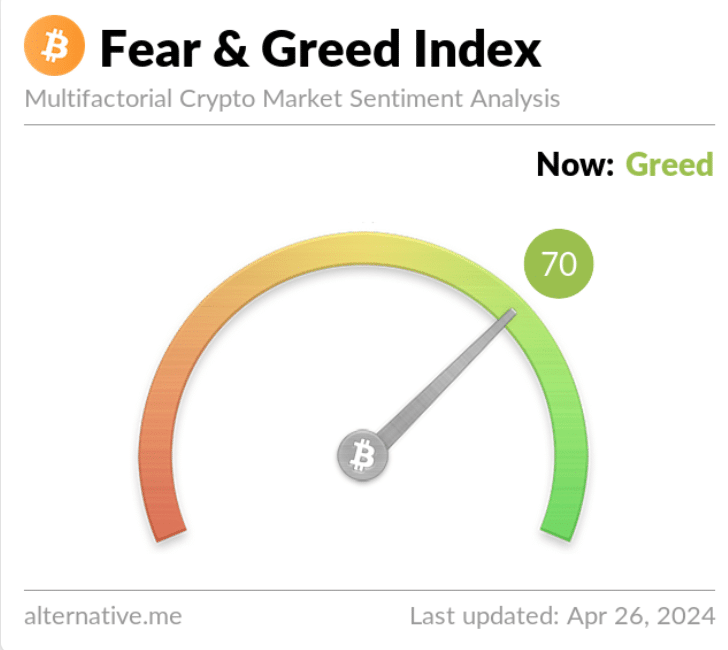
Source: Alternative.me
Read Bitcoin [BTC] Price Prediction 2024 -2025
AMBCrypto then took a quick look at BTC’s daily chart to better understand whether the coin would turn volatile. We found that BTC failed to go above its 20-day Simple Moving Average (SMA).
Moreover, both its Chaikin Money Flow (CMF) and Relative Strength Index (RSI) went sideways, indicating that investors might witness a few more slow-moving days.

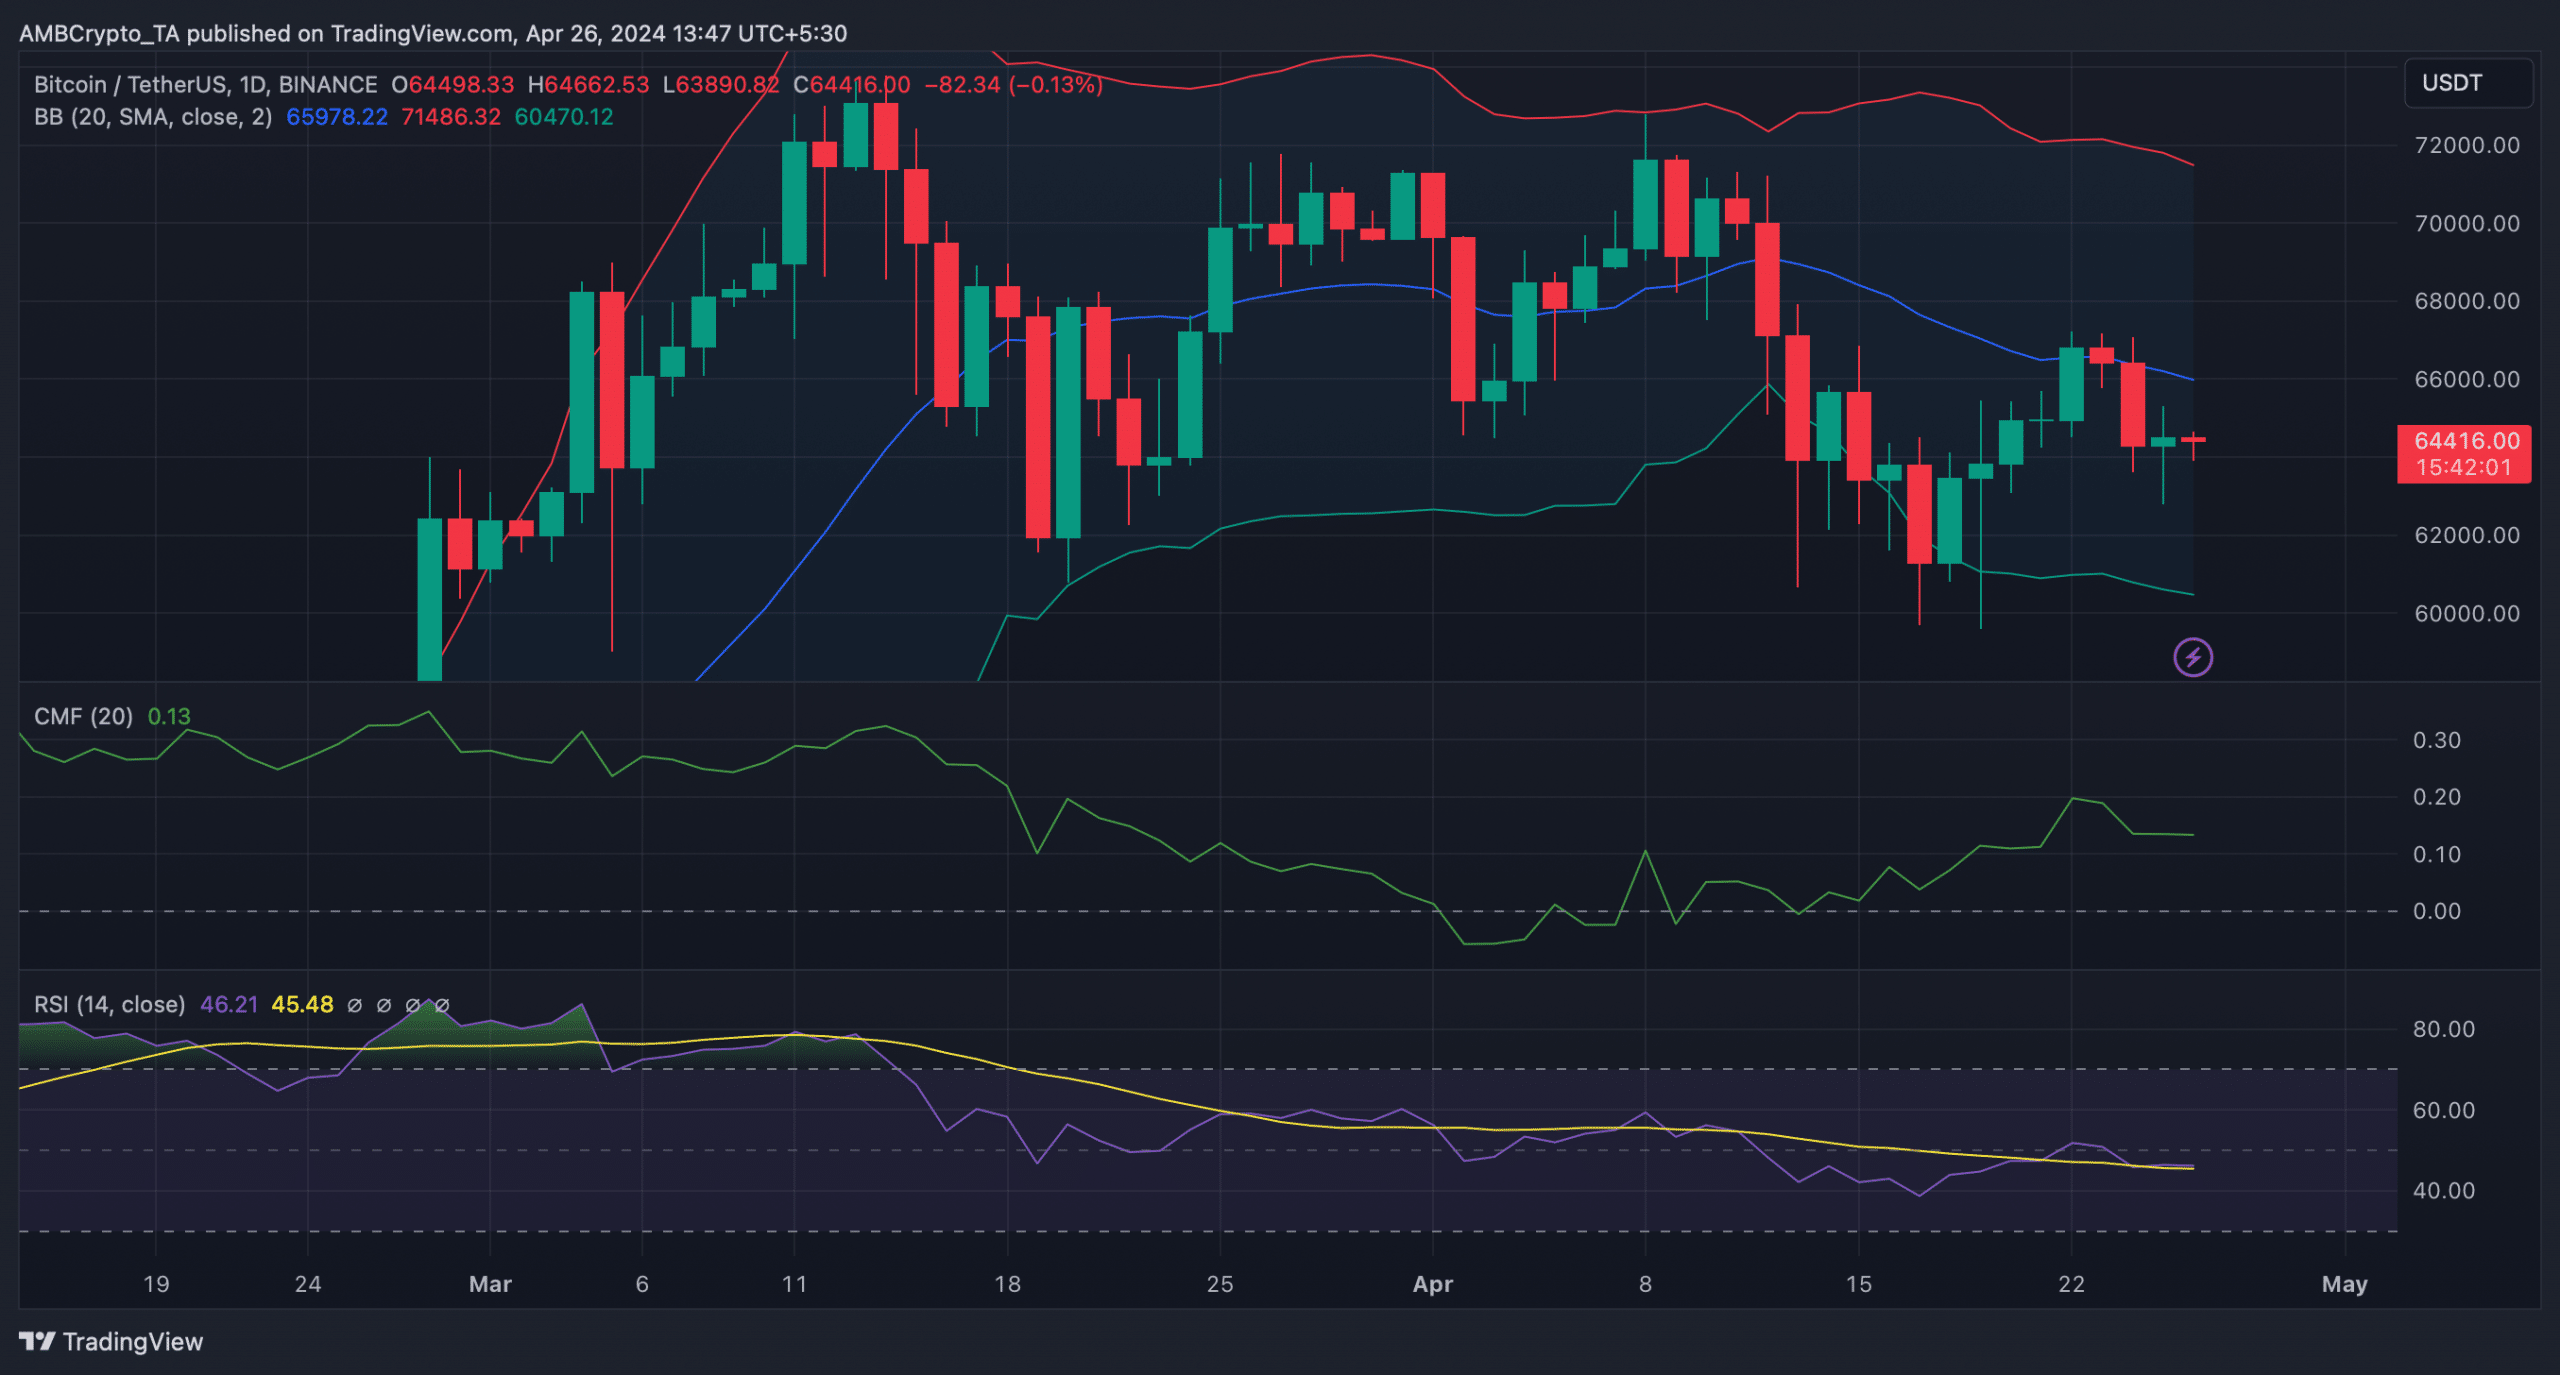
Source: TradingView

Robert Johnson is a UK-based business writer specializing in finance and entrepreneurship. With an eye for market trends and a keen interest in the corporate world, he offers readers valuable insights into business developments.