
- ETH’s supply on exchanges hiked over the last few days
- A metric revealed that ETH was undervalued, hinting at a price uptick on the charts
It has been only two days since the much-anticipated spot Ethereum [ETH] ETFs were approved by the U.S Securities and Exchange Commission (SEC). However, the outcome of this approval didn’t turn out to be as expected, with ETH soon turning bearish on the charts. Hence, it’s worth taking a closer look at what’s going on.
Ethereum ETF approval goes wrong
AMBCrypto reported previously that the U.S SEC approved eight applications for spot Ethereum [ETH] exchange-traded funds (ETFs) on 23 May. The regulator approved 19b-4 forms for the ETF applications filed by BlackRock, Fidelity, Grayscale, Bitwise, VanEck, Ark, Invesco Galaxy, and Franklin Templeton.
Now, although many expected ETH’s price to boom after that, the opposite happened. According to CoinMarketCap, ETH’s week-long bull rally came to an end as its price dropped by almost 2% in the last 24 hours. At press time, it was trading at $3,766.04 with a market capitalization of over $452 billion.
Ali, a popular crypto-analyst, recently shared a tweet stating that there were quite a few possible reasons behind this bearish price action. As per the same, ETH registered a significant sell-off soon after the approval, one which could have been a profit-taking move by investors. For instance, Jeffrey Wilke, one of the co-founders of Ethereum, transferred 10,000 ETH, worth around $37.38 million.
Additionally, the king of altcoins’ supply on exchanges also spiked, further establishing the fact that selling pressure on the token has been high. Apart from this, a key indicator, TD sequential, also flashed a sell signal on ETH’s price chart.
However, the bearish price trend might change under one condition. According to Ali, ETH has a resistance level between $3,940 and $4,054. As per the tweet, if ETH manages to record a daily candlestick and close above $4,170, the bearish trend might come to an end.
Are bears willing to let go?
AMBCrypto then analyzed ETH’s on-chain metrics to see whether they support the possibility of ETH going above the aforementioned resistance zone. As per our analysis of Glassnode’s data, ETH’s NVT ratio registered a sharp decline. A drop in the metric means that an asset is undervalued, hinting at a price uptick on the charts.
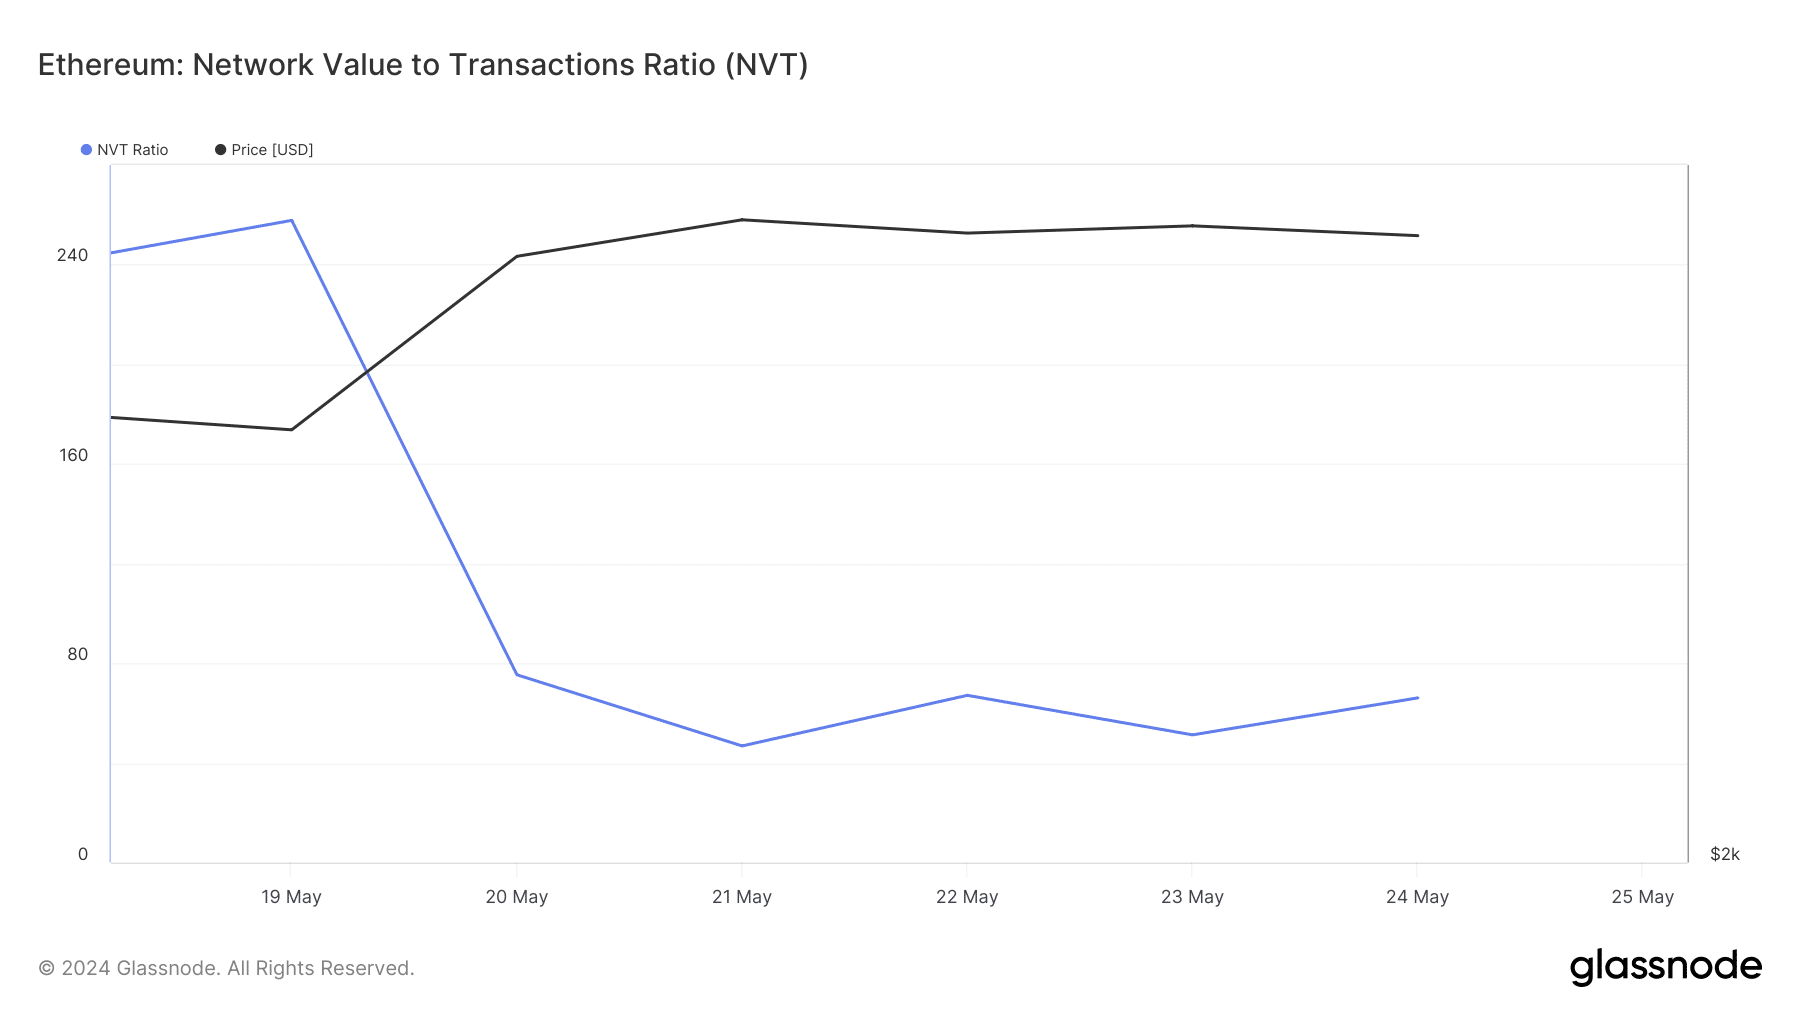
Source: Glassnode
However, ETH’s fear and greed index had a value of 67% at press time, meaning that the market was in a “greed” phase. Whenever the metric reaches that level, it indicates that the chances of a price correction are high. To better understand what to expect, AMBCrypto then checked Ethereum’s daily chart.
Is your portfolio green? Check out the ETH Profit Calculator
We found that ETH’s Chaikin Money Flow (CMF) took a sideways route over the last few days. A similar trend was also noted by the Relative Strength Index’s (RSI) chart.
These indicators suggested that investors might witness a few more slow-moving days.

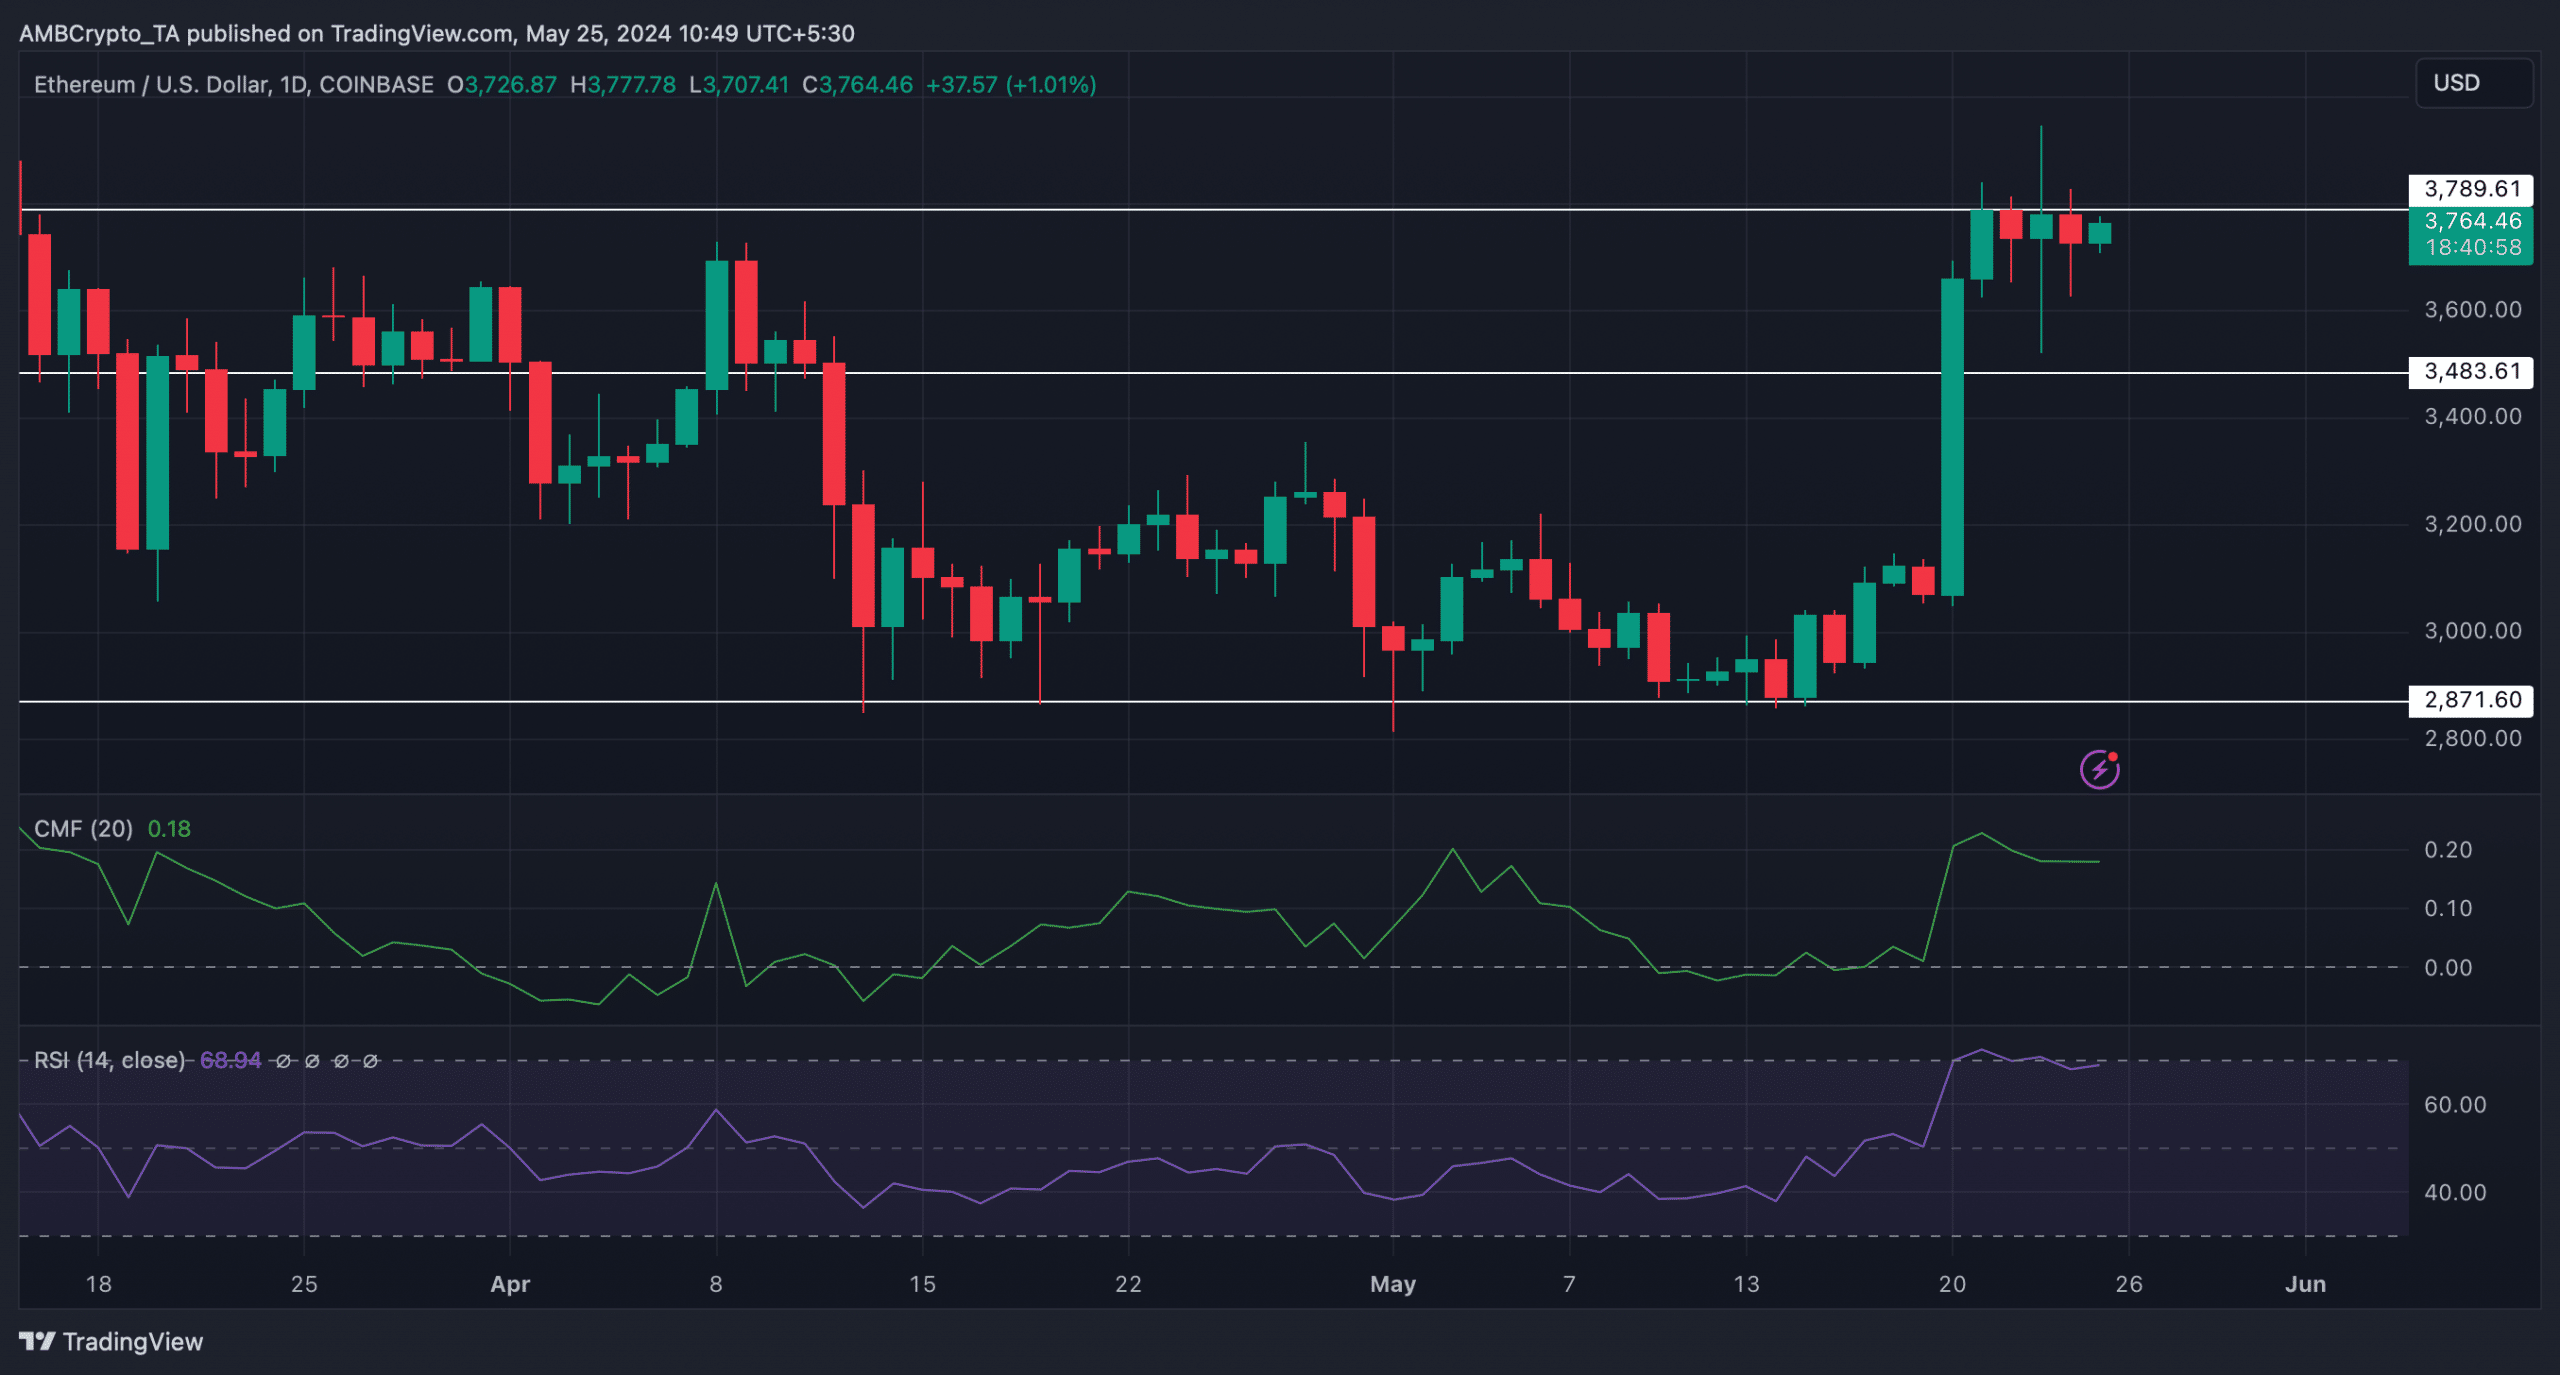
Source: TradingView

Robert Johnson is a UK-based business writer specializing in finance and entrepreneurship. With an eye for market trends and a keen interest in the corporate world, he offers readers valuable insights into business developments.