- MATIC may be due for a double-digit rally, according to analyst Ali Martinez.
- However, it might face headwinds in the short term.
Polygon [MATIC] is due for a 17% price rally if it breaks above its parallel channel, crypto analyst Ali Martinez has noted in a post on X (formerly Twitter).
Assessing the L2 token’s movements on a 4-hour chart, Martinez found that its price has consolidated within a range since the beginning of April to form the parallel channel pattern.
This pattern is formed when an asset’s price action is confined between two trend lines, indicating a period of consolidation.
MATIC may not be ready
At press time, MATIC exchanged hands at $0.72 and trended toward the upper line of its parallel channel.
When an asset rallies toward the upper trendline of a parallel channel, it is interpreted as an attempt to test resistance.
If that position fails to hold, and a breakout ensues, the asset in question may record new price highs.
However, AMBCrypto found that MATIC’s rally above this resistance level may be challenging in the short term.
This is because the token’s price trades significantly close to its 20-day Exponential Moving Average (EMA).
When an asset’s price fluctuates around this moving average, it hints at indecision in the market, with neither buyers nor sellers able to establish dominance.
For a break above the resistance to occur, there has to be a surge in buying pressure, which puts the bulls in clear market control.
However, with MATIC’s MACD line (blue) gearing to fall below its signal line (orange), bear power might be on the rise.
When an asset’s MACD line attempts to fall below its signal line, it’s generally interpreted as a bearish signal. It suggests a weakening upward momentum and a shift toward a downtrend.
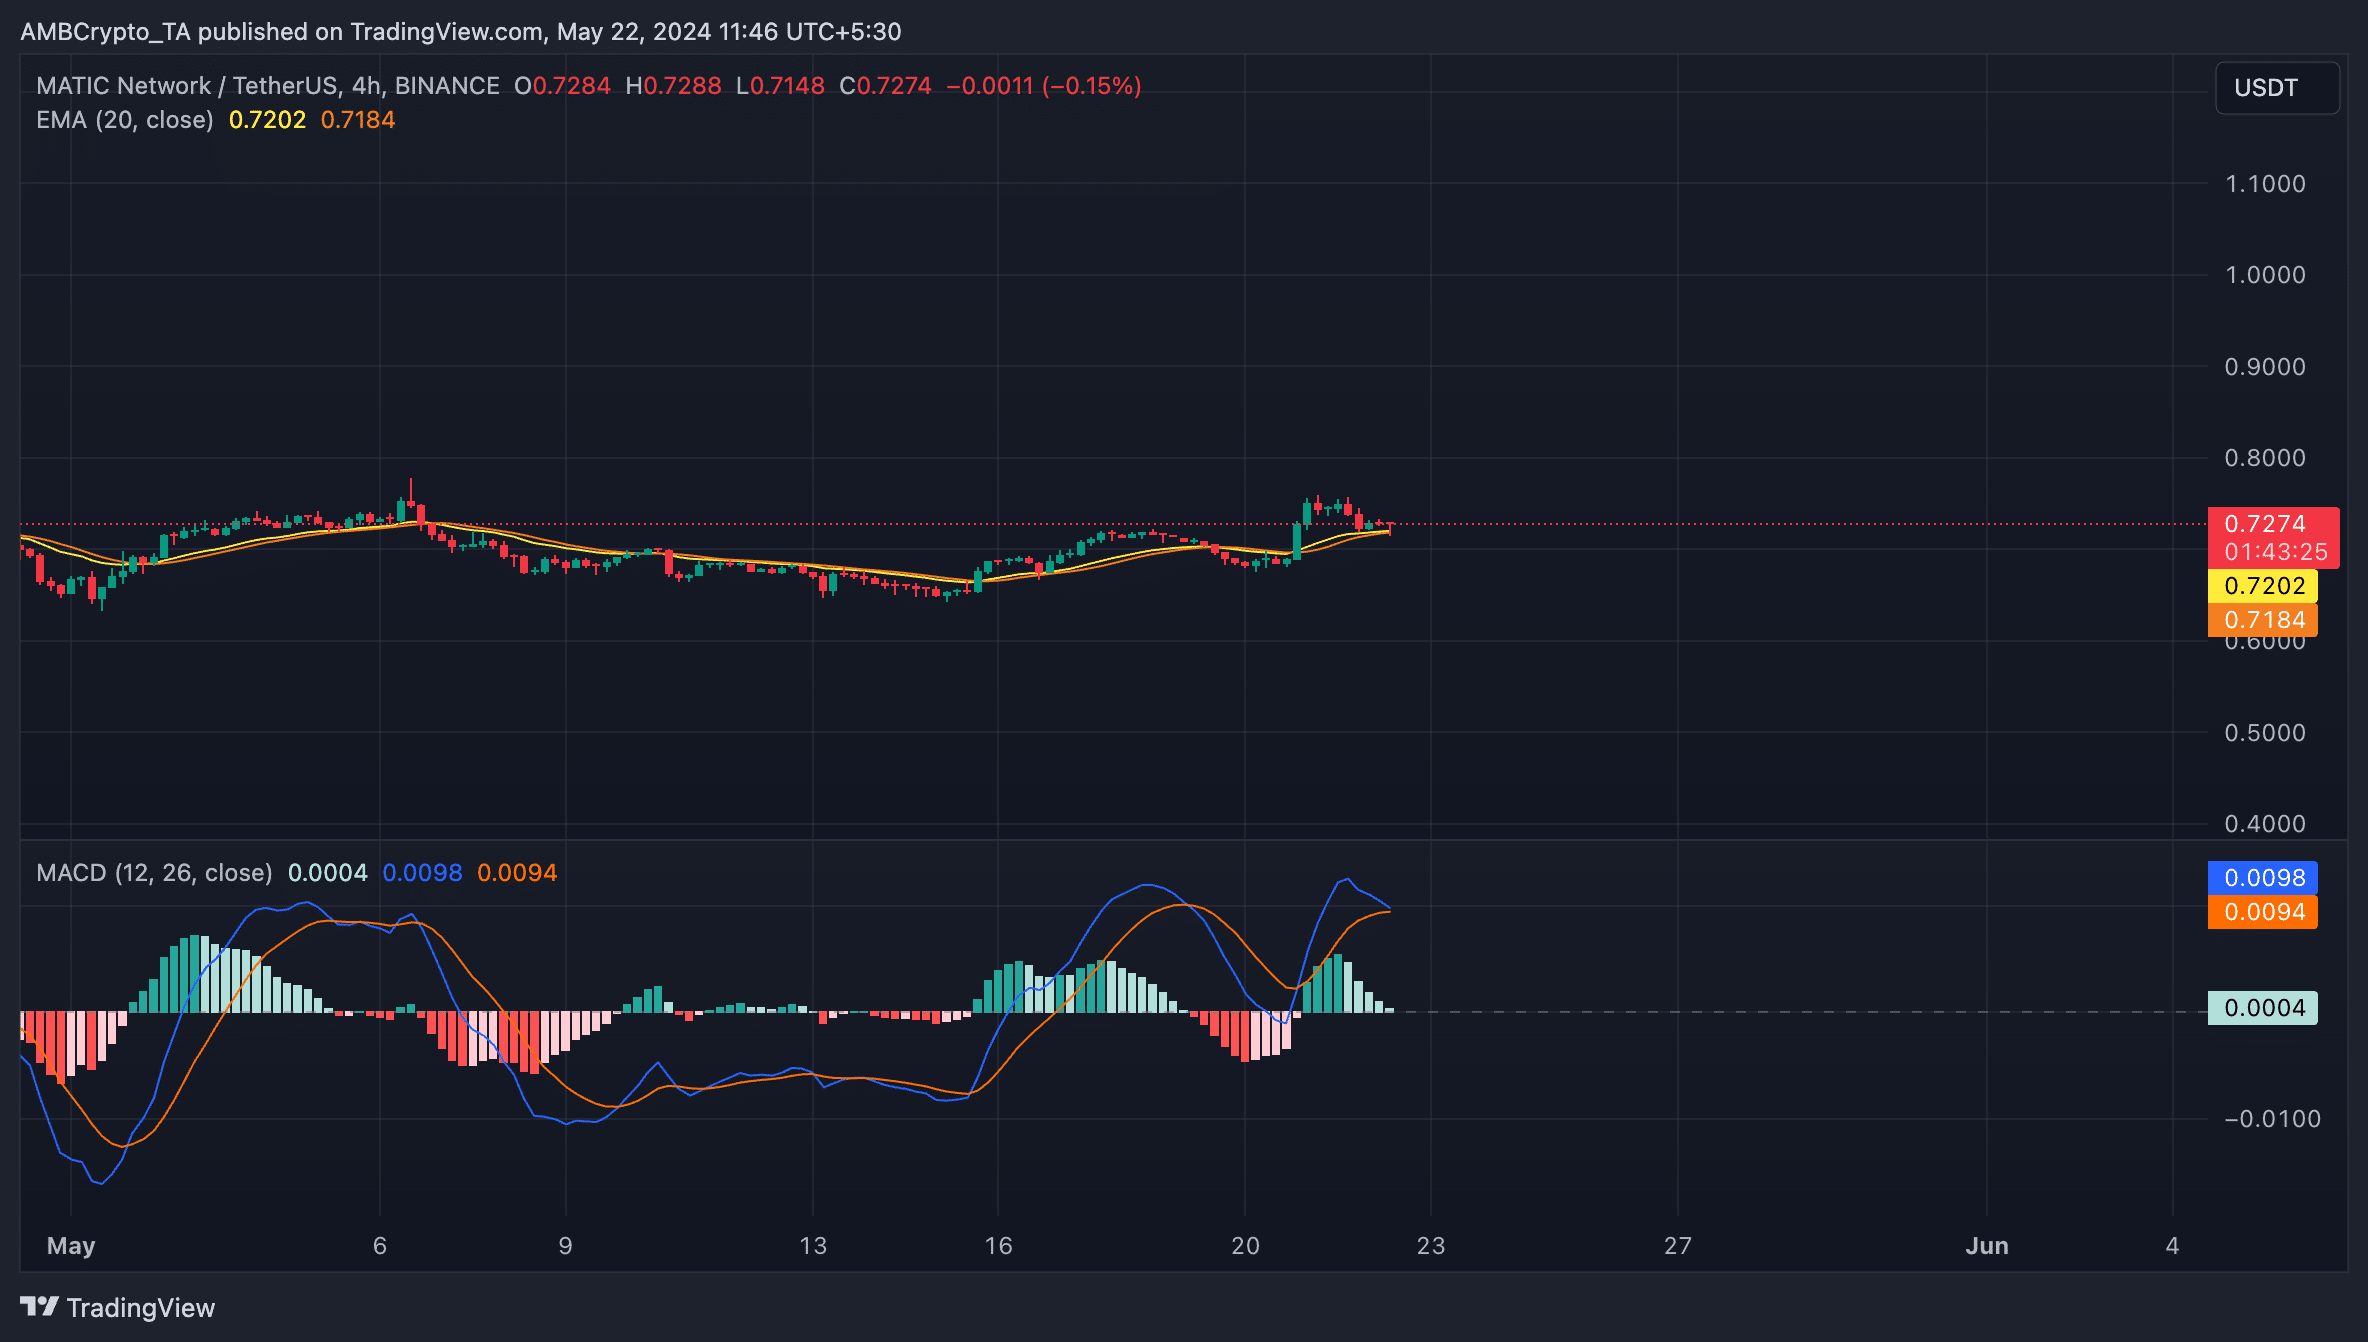
Source: MATIC/USDT on TradingView
A good place to buy?
MATIC’s Market Value to Realized Value (MVRV) ratio, assessed using a 365-day moving average, has flashed a buy signal.
According to Santiment’s data, this metric’s value was -12.58% as of this writing. The metric measures the ratio between MATIC’s current market price and the average price of every token acquired.

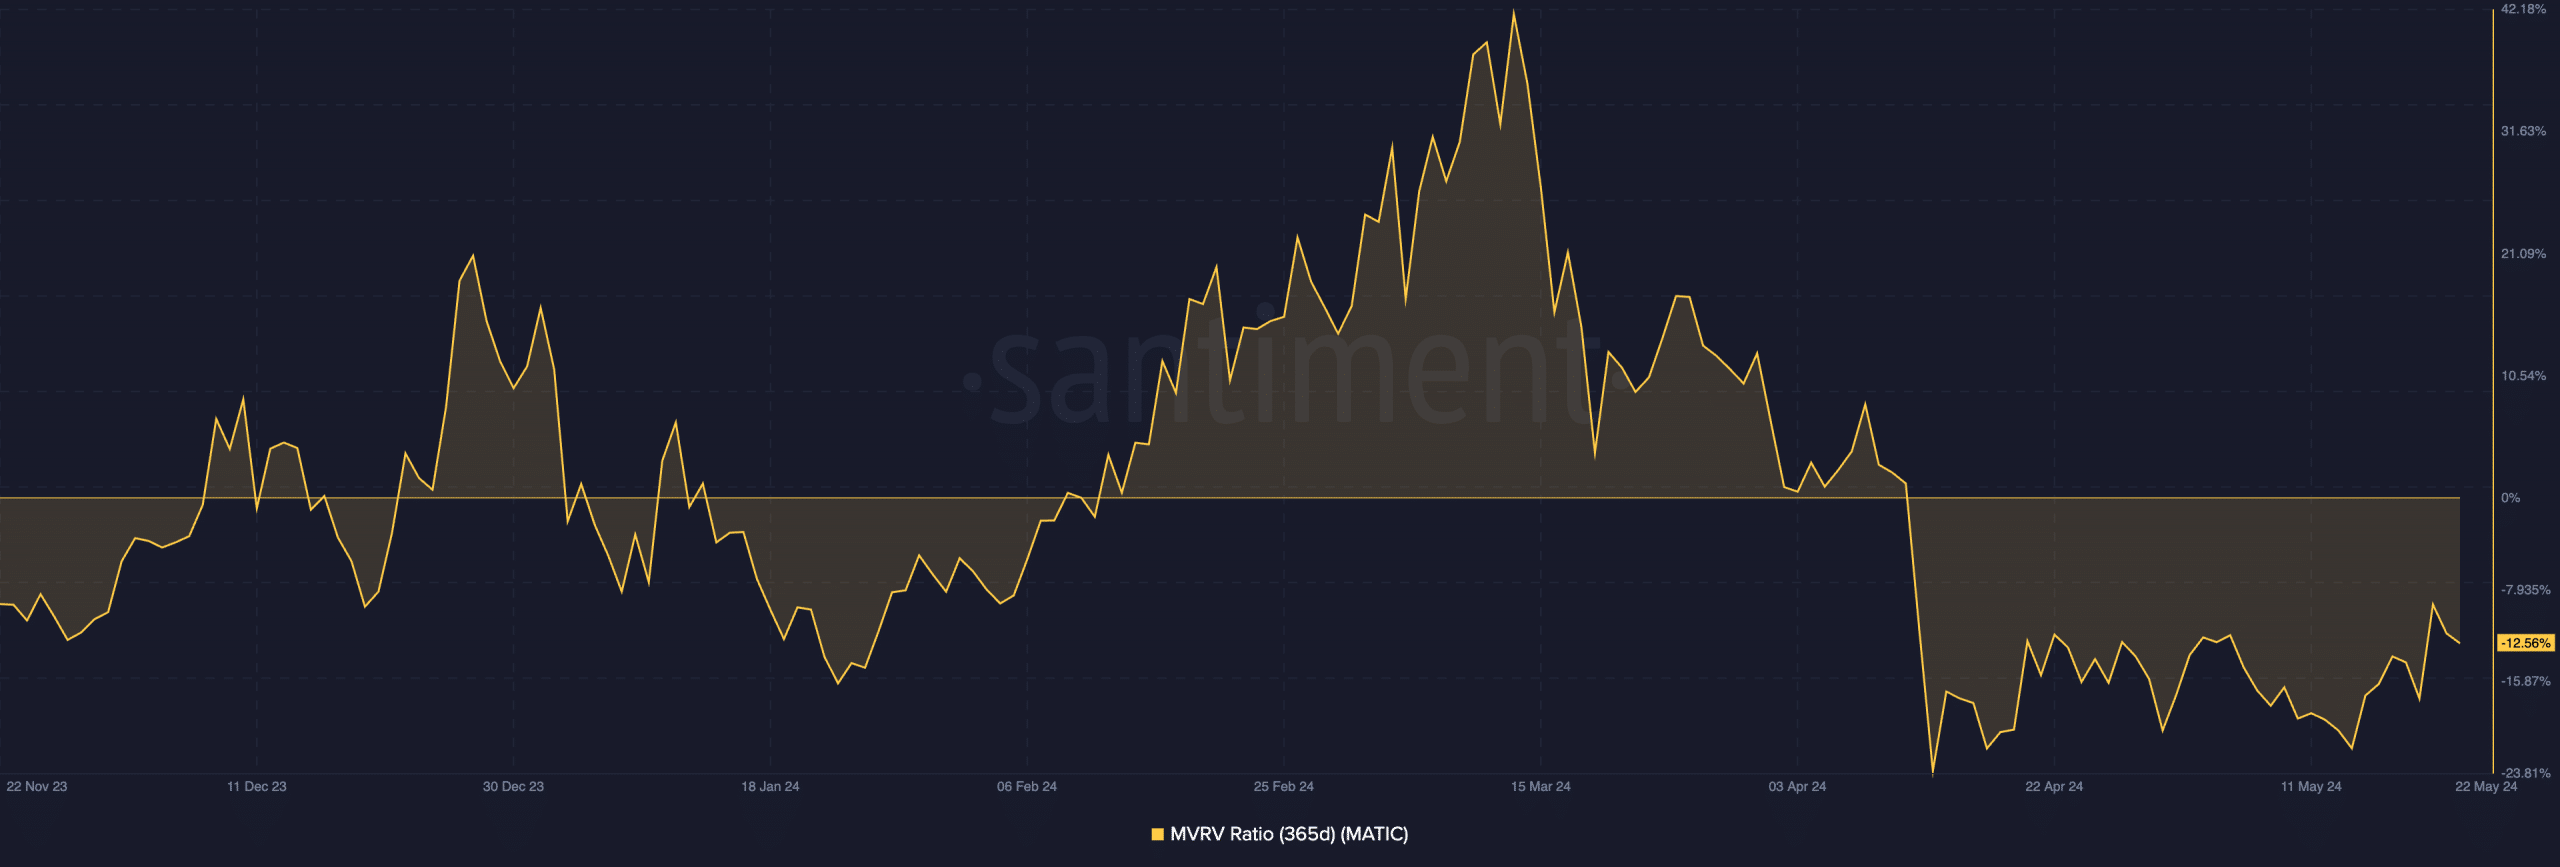
Source: Santiment
Read Polygon’s [MATIC] Price Prediction 2024-2025
When it returns a negative value like this, MATIC is deemed to be undervalued, as its market value is below the average purchase price of all its tokens in circulation.
It is seen as a buy signal because traders see it as an opportunity to buy the token at a discount compared to the historical cost basis.

Robert Johnson is a UK-based business writer specializing in finance and entrepreneurship. With an eye for market trends and a keen interest in the corporate world, he offers readers valuable insights into business developments.