
- SHIB whales have reduced their holdings on exchanges.
- If demand continues to stall, SHIB’s price may fall below $0.00002.’
Top whale wallets that hold Shiba Inu [SHIB] across cryptocurrency exchanges have decreased their holdings since the end of May, according to Santiment’s data.
According to the on-chain data provider, this cohort of SHIB investors currently holds 168 trillion SHIB coins, representing 29% of the memecoin’s total circulating supply of 589 trillion SHIB.
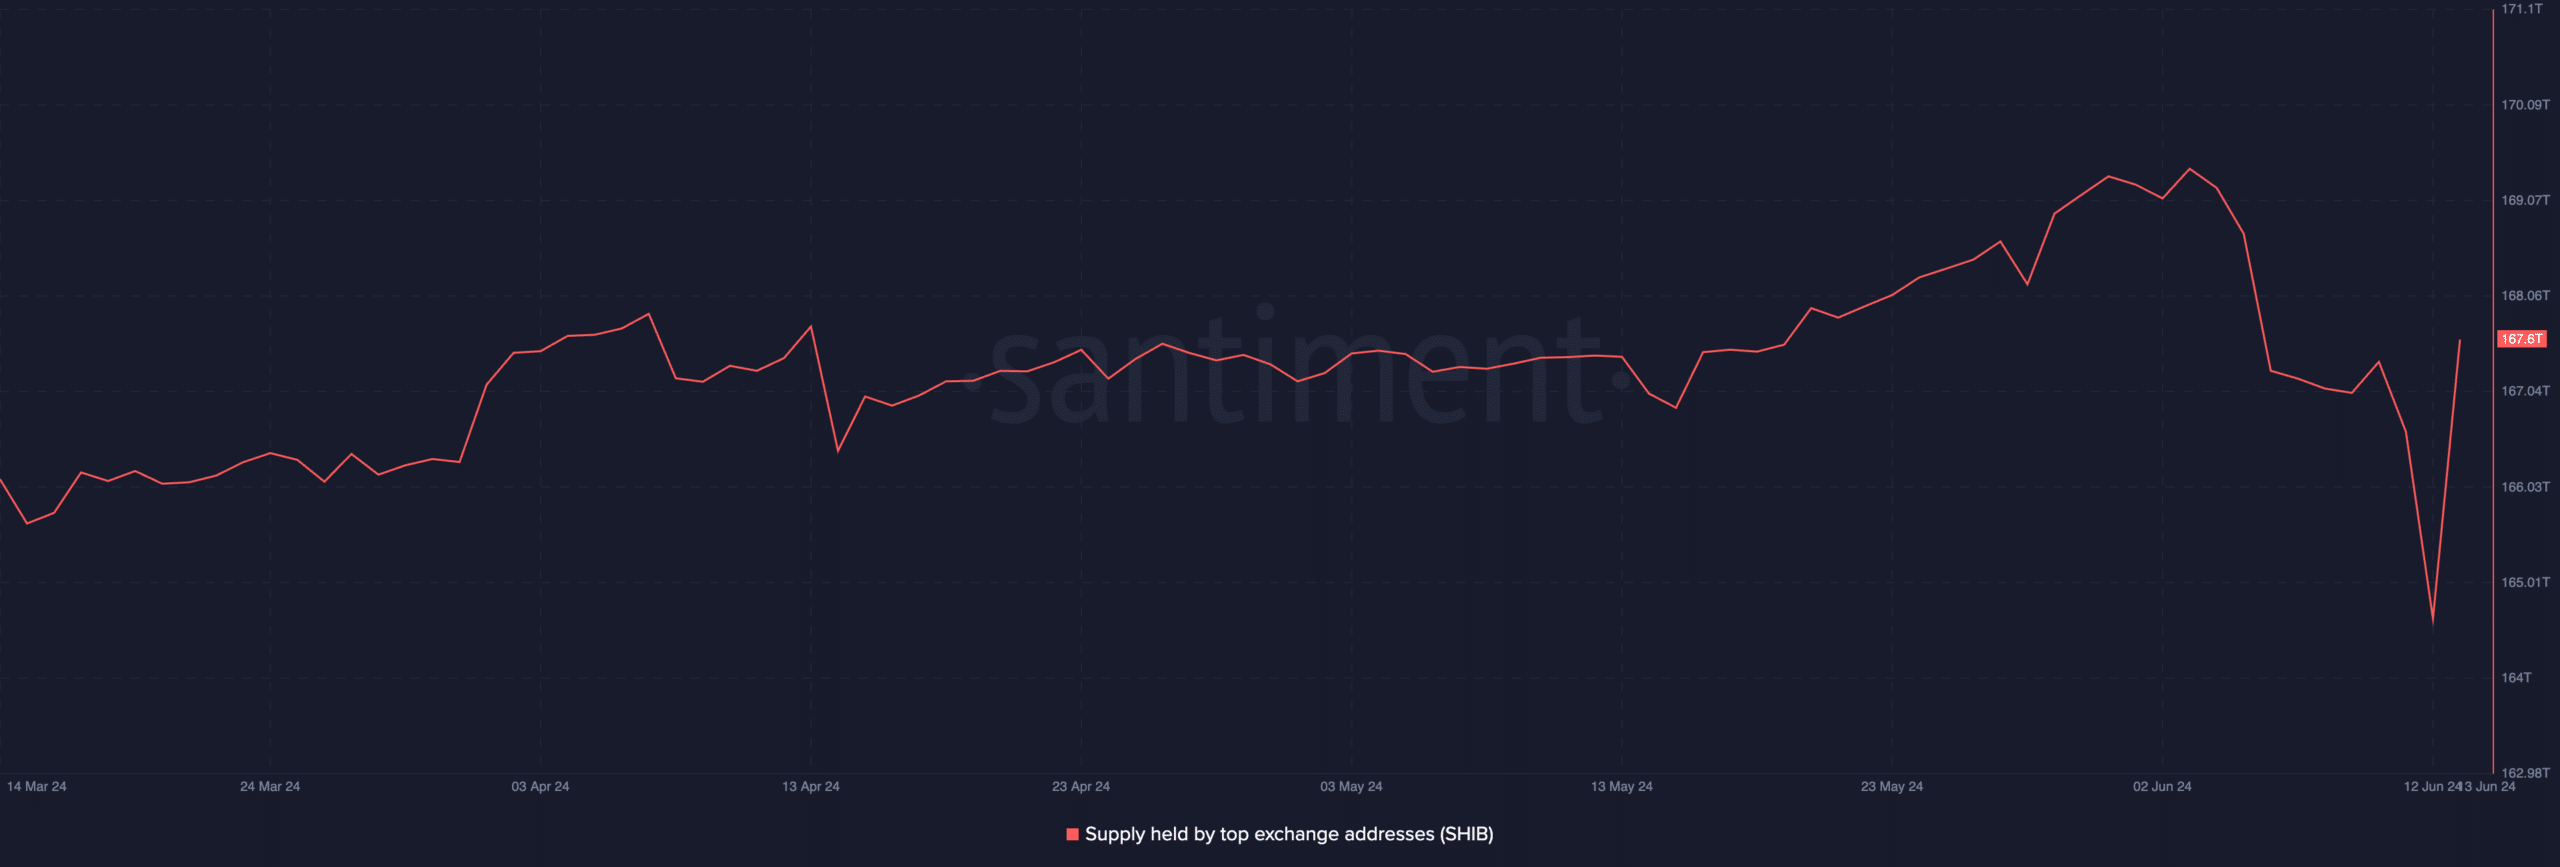
Source: Santiment
SHIB has new lows to hit before a rebound
Generally, when the amount of coins that these top wallets hold on exchanges decreases, it is a long-term bullish signal, hinting at the possibility of a price uptick.
If their holdings are being moved off exchanges and not sold, it could be a sign that the whales are accumulating for the long term, potentially bullish.
However, the trend in the SHIB market suggests otherwise. Its price has declined significantly in the past few weeks.
Therefore, the decline in whale holdings on exchanges indicates that this group of SHIB investors may be cashing out on their profits, leading to a further price drop.
At press time, SHIB was worth $0.000021. According to CoinMarketCap’s data, the memecoin’s price has dropped by 15% in the last week alone.
AMBCrypto assessed the coin’s performance on a daily chart and found a spike in SHIB distribution among market participants. For example, its Relative Strength Index and Money Flow Index (MFI) trended downward at press time.
SHIB’s RSI and MFI were 38.10 and 26.34, positioned below their respective center lines. These values showed that selling pressure significantly outweighed buying activity in the SHIB market.
Further, confirming the bearish bias toward the altcoin, the dots of its Parabolic Stop and Reverse (SAR) indicator were above its price. They have been so positioned since 2 June.
This indicator identifies an asset’s potential trend direction and price reversals.
When its dotted lines are placed above an asset’s price, the market is said to be in a decline. It indicates that the asset’s price has been falling and may continue.

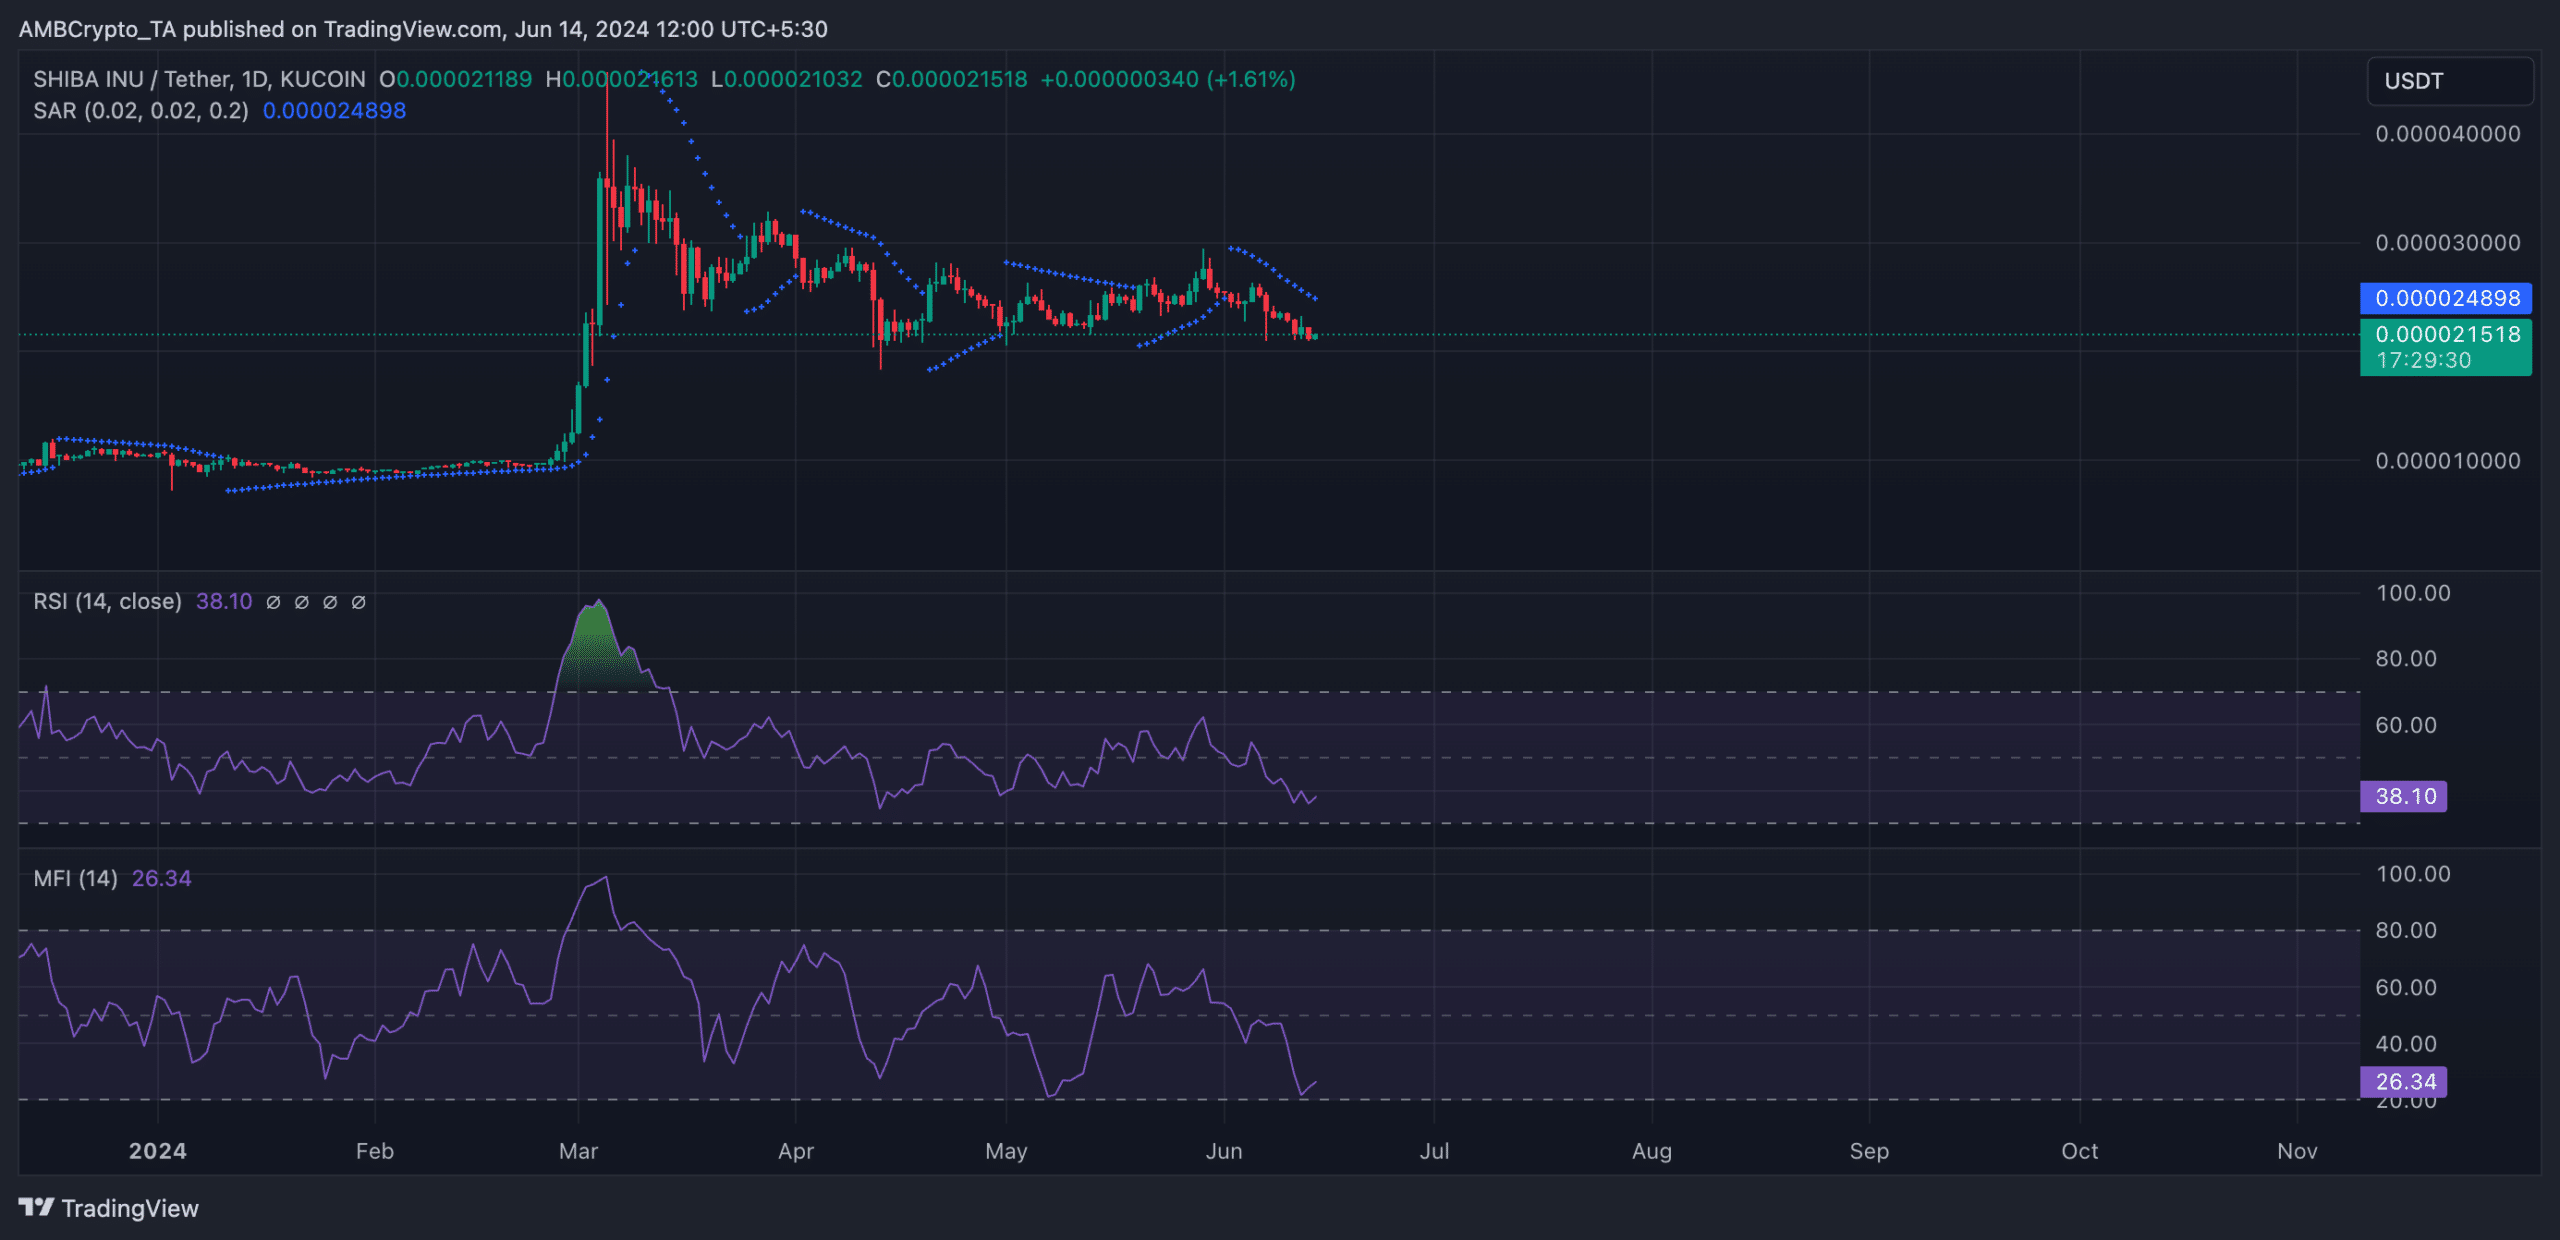
Source: TradingView
Read Shiba Inu’s [SHIB] Price Prediction 2024-25
If SHIB’s value continues to fall, it may slip below the $0.00002 price region and drop to $0.000018.

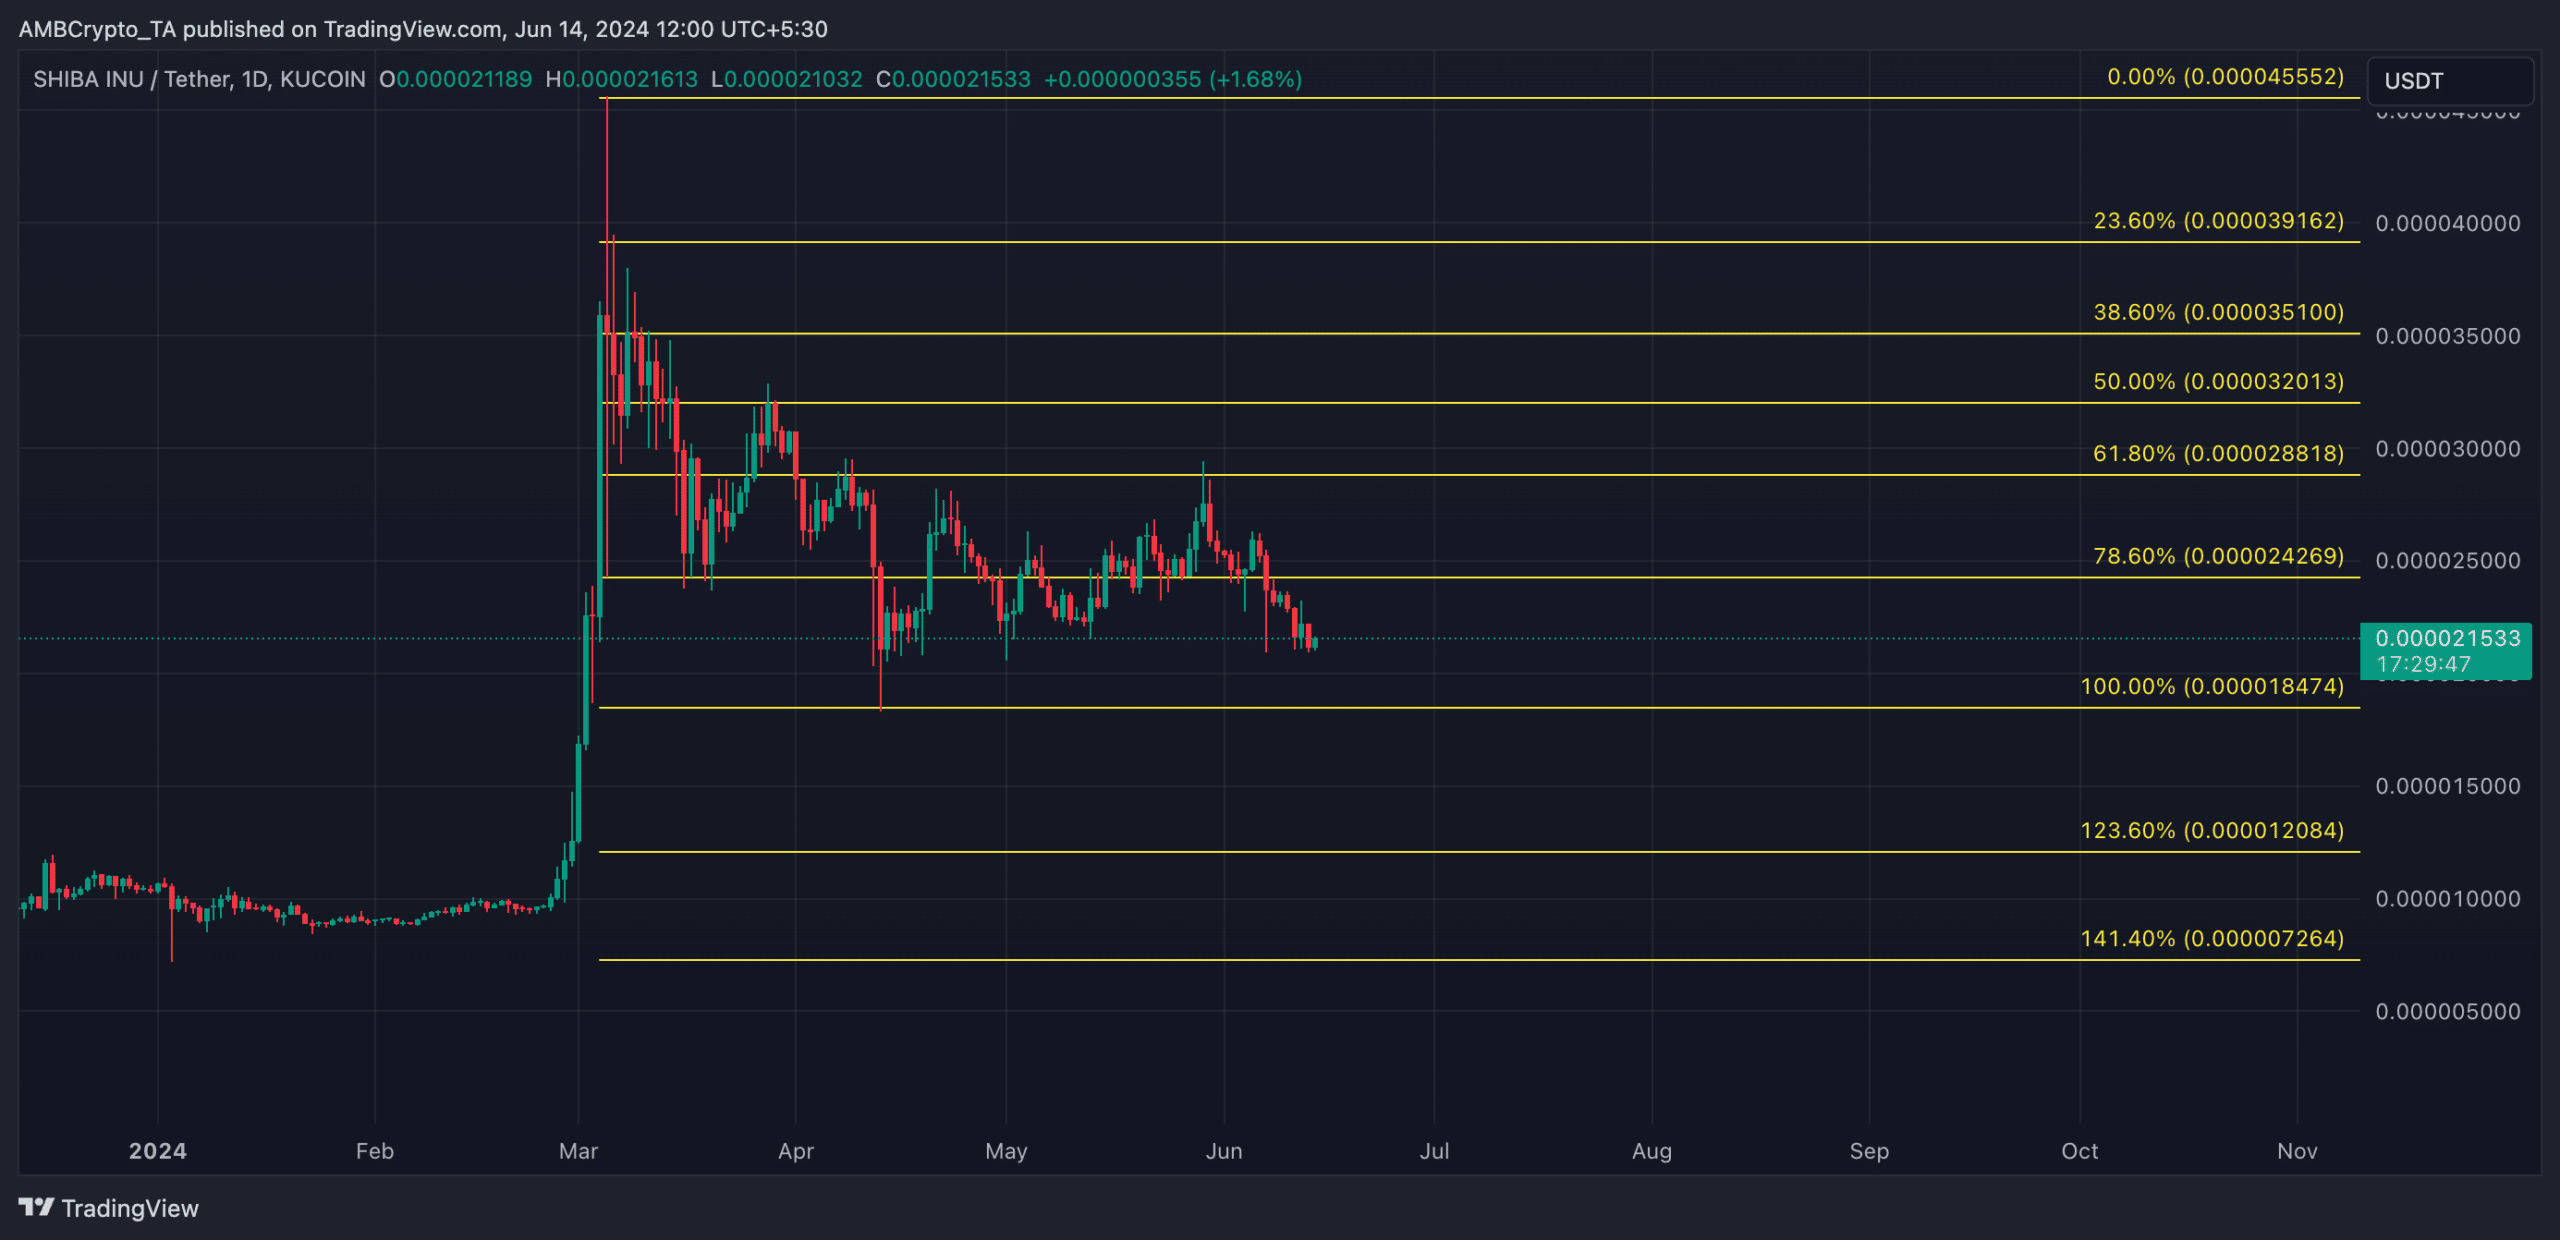
Source: TradingView
However, if this is invalidated and buying momentum skyrockets, it may drive SHIB’s value to $0.000024.
Robert Johnson is a UK-based business writer specializing in finance and entrepreneurship. With an eye for market trends and a keen interest in the corporate world, he offers readers valuable insights into business developments.