
There’s a big puzzle when it comes to the expanding Universe: a puzzle so large that many have declared there’s a crisis in cosmology. That puzzle is known as the Hubble tension, as two different classes of approaches to measure how fast the Universe is expanding lead to different, incompatible results. The “early relic” method, which relies on cosmic signals imprinted during the hot Big Bang that persist even as the Universe ages, leads to ~67 km/s/Mpc, with an uncertainty of just 1 km/s/Mpc. Meanwhile, the “distance ladder” method, which involves determining the distance to progressively farther away objects, leads to a value of ~73 km/s/Mpc, with again an uncertainty of just 1 km/s/Mpc.
But another group, using a different distance ladder method than the most precise one, finds an in-between value of around 70 or 71 km/s/Mpc for the rate of expansion, with an uncertainty of 2 or 3 km/s/Mpc. Many sources are claiming that this can resolve the Hubble tension, and that perhaps there is no crisis in cosmology after all, just an over-reliance on overly confident claims.
That’s simply not true, and everyone can learn to understand why that is. These new measurements are simply too great in uncertainty to be of value in this argument just yet, as a “distance ladder” is only as certain as its weakest “rung” just like a chain is only as strong as its weakest link. Here’s how it all works.
Taking us beyond the limits of any prior observatory, including all of the ground-based telescopes on Earth as well as Hubble, NASA’s JWST has shown us the most distant galaxies in the Universe ever discovered. If we assign 3D positions to the galaxies that have been sufficiently observed-and-measured, we can construct a visualized fly-through of the Universe, as the CEERS data from JWST enables us to do here. At greater distances, compact, star-forming galaxies are more common; at closer distances, more diffuse, quiescent galaxies are the norm.
Early relics
If we go all the way back in the history of the Universe, beyond the limits of what even the JWST can probe, we come to an epoch known as the dark ages: before any stars or galaxies had formed. Early on, the Universe was hot, dense, and relatively uniform, and the farther back in time we look, the hotter it was. At some point, it was so hot that there were no neutral atoms: just an ionized plasma of electrons, protons, and heavier atomic nuclei amidst a sea of photons. The initial “seed” imperfections, imprinted on our Universe by cosmic inflation, began to gravitate, with overdense regions attracting matter and underdense regions giving up their matter to their denser surroundings, all while the Universe expands and cools.
For as long as the Universe remains in this hot, dense, ionized state, the overdense regions become very interesting. Inside of them:
- gravity works to draw matter-and-radiation into them,
- as the radiation density increases, so does the (outward) radiation pressure,
- and while the dark matter infalls without resistance,
- the normal matter gets “pushed” out by this increased radiation pressure.
As a result, we get a series of features — acoustic oscillations — that get imprinted into the structure of the Universe. They initially appear as peaks-and-valleys, or wiggles, in the cosmic microwave background.
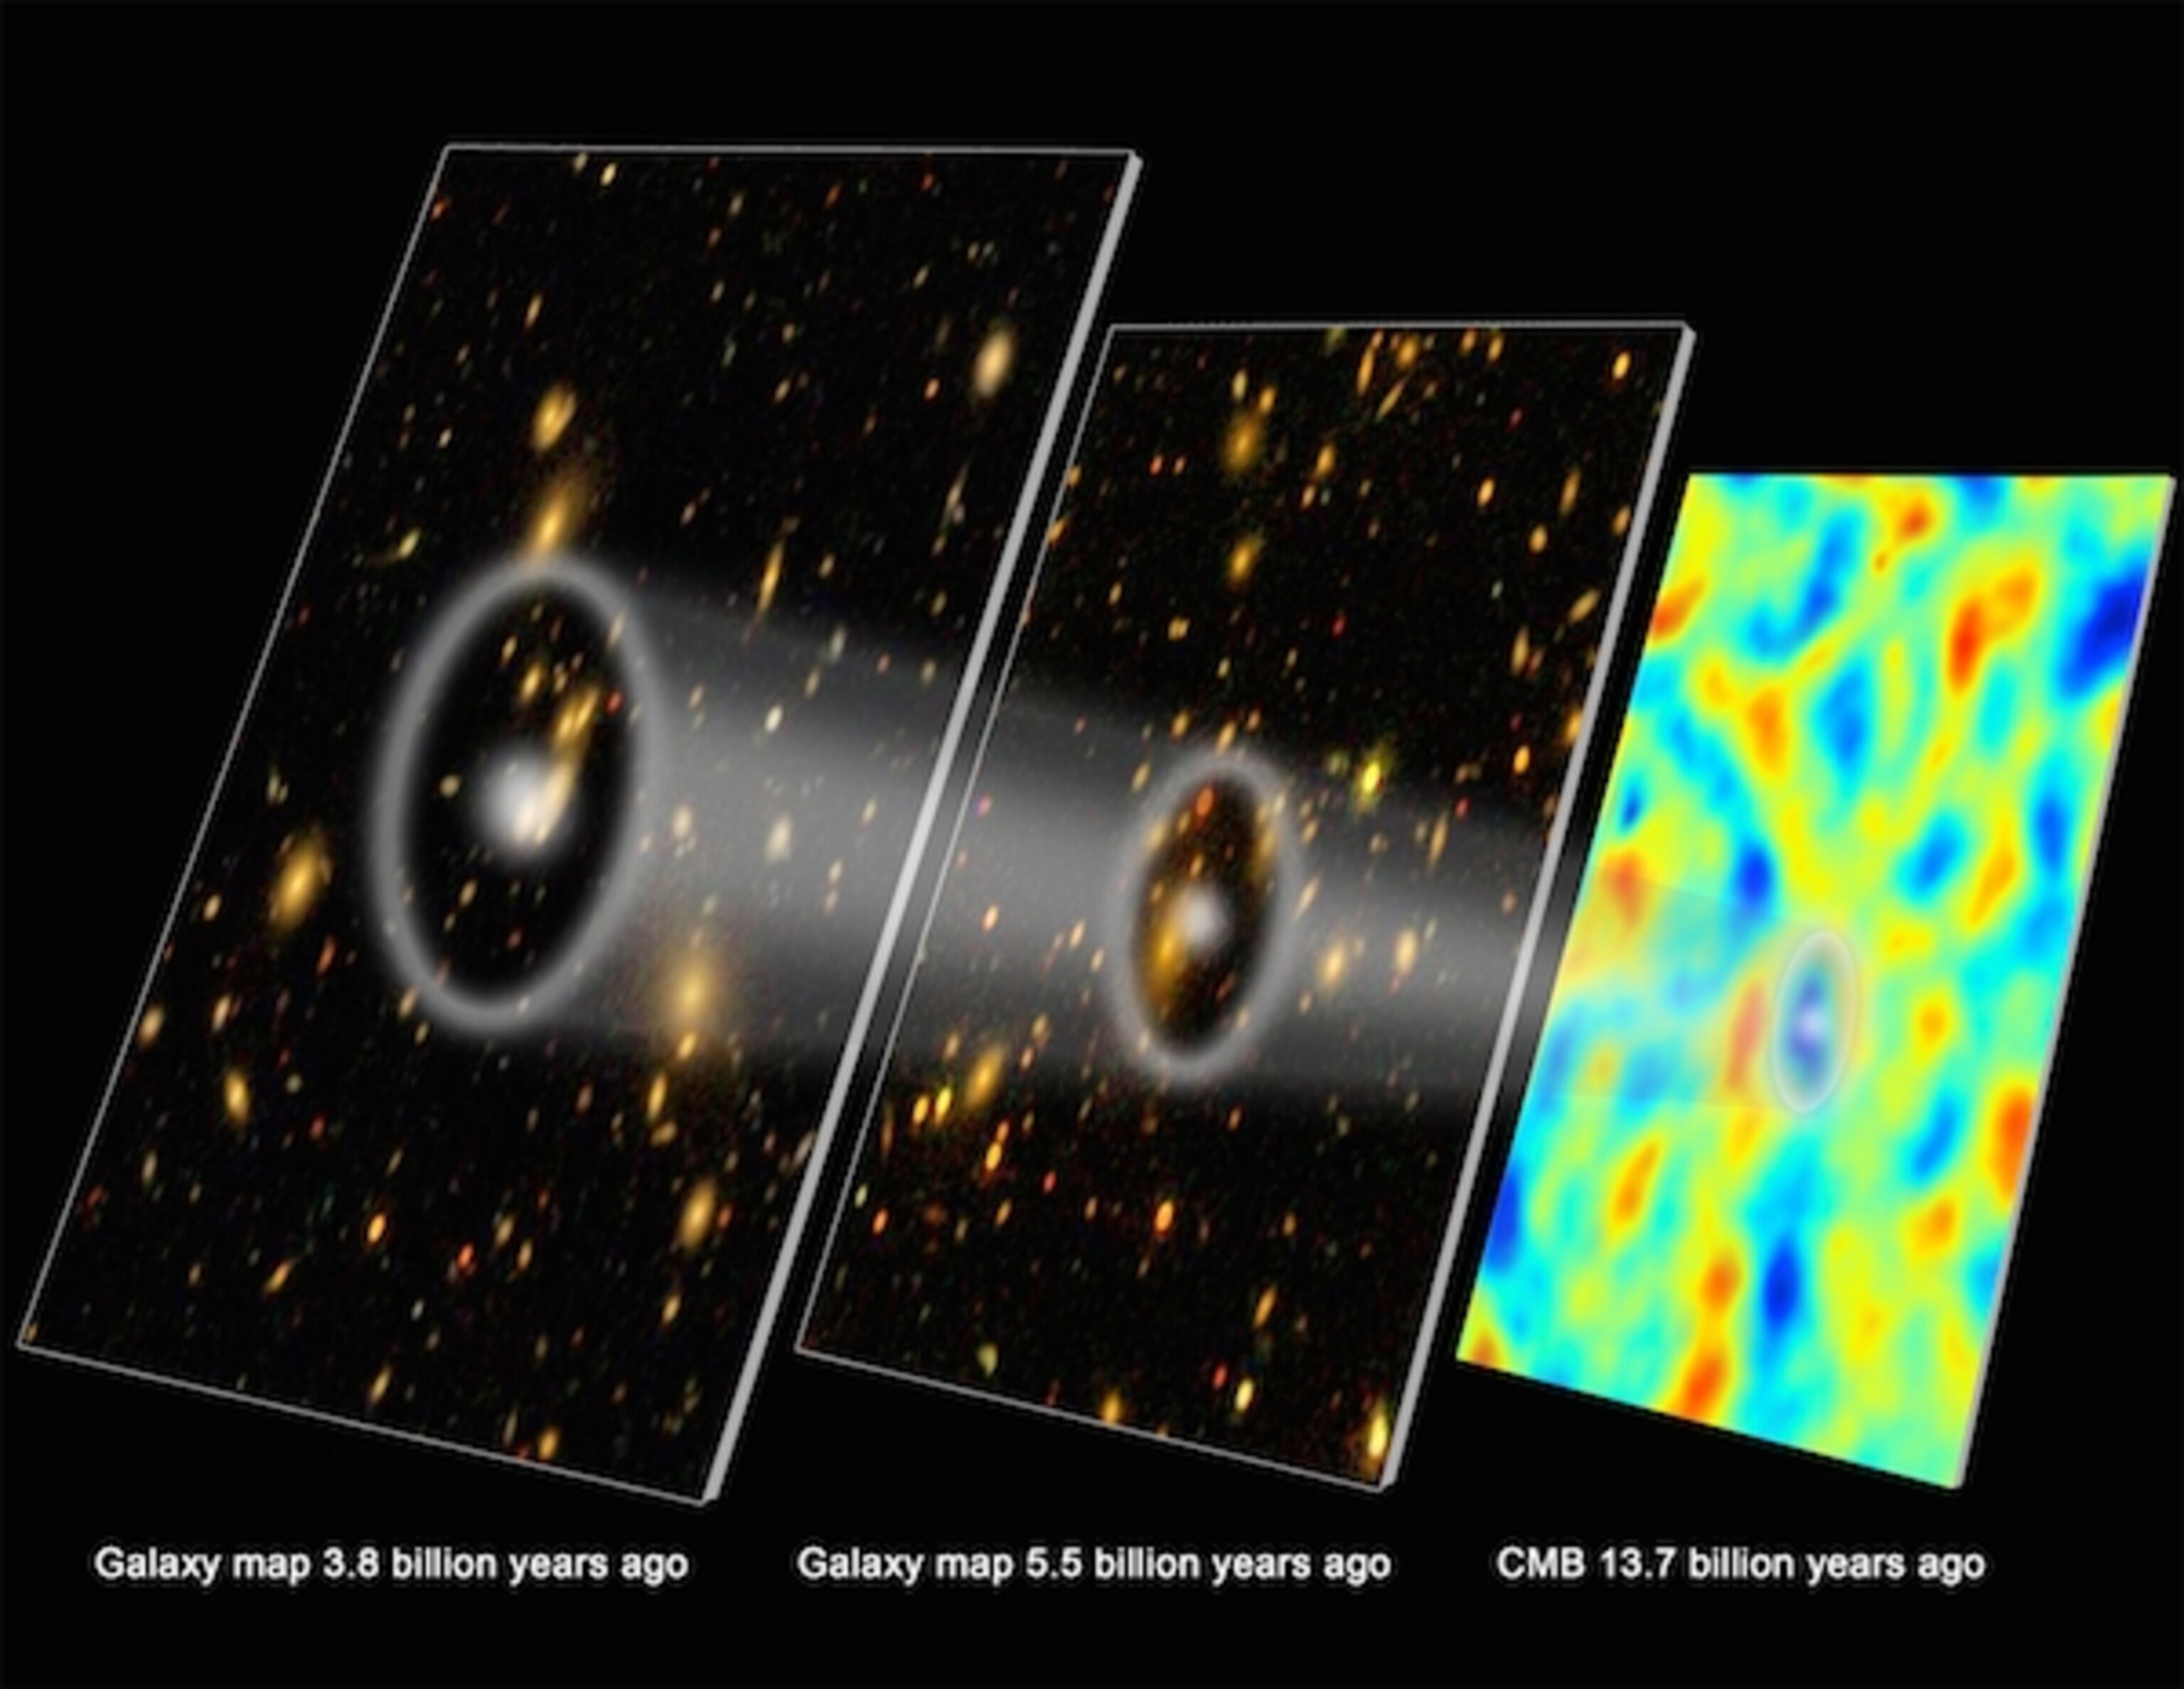
We can look arbitrarily far back in the Universe if our telescopes allow, and the clustering of galaxies should reveal a specific distance scale – the acoustic scale – that should evolve with time in a particular fashion, just as the acoustic “peaks and valleys” in the cosmic microwave background reveal this scale as well. The evolution of this scale, over time, is an early relic that reveals a low expansion rate of ~67 km/s/Mpc, and is consistent from CMB features to BAO features.
However, they also appear later on in the distribution of galaxies. In particular, the scale of the first (largest) acoustic “peak” in the cosmic microwave background is a scale that, at late times, corresponds to the most likely scale to find galaxies distributed in bubble-like features with a specific radius. When we measure the three-dimensional positions of large numbers of galaxies over large volumes of space — including at nearby, intermediate, and very large distances — we can see how the scale of these bubble-like features (or the most likely separation distances between galaxies) evolves. This shows up in galaxy surveys as a feature known as baryon acoustic oscillations, or BAO for short.
When the WMAP satellite returned its data of the cosmic microwave background, we saw it was consistent with the prevailing view of the Universe at the time: that its expansion rate was around 71 km/s/Mpc. However, the Planck satellite, which succeeded WMAP, returned more precise data that lowered the uncertainties and favored a value of ~67 km/s/Mpc, with an uncertainty of just 1-2%. Now, thanks to the latest results from the Dark Energy Spectroscopic Instrument (DESI) collaboration, we can see that BAO data also supports this lower value, and places an upper-limit of about ~69 km/s/Mpc as far as wiggle-room is concerned. From all early relic sources, we get a lower value favored for the rate of cosmic expansion.
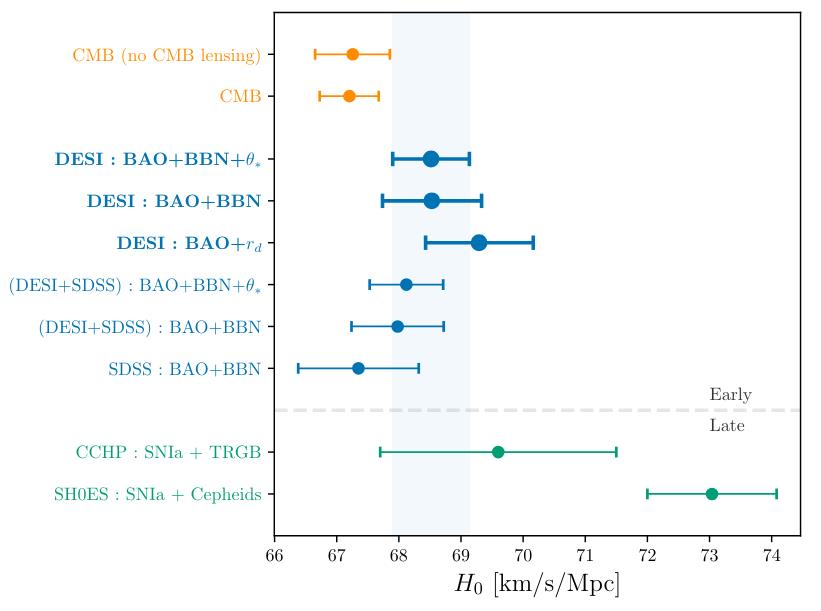
A large class of early relic methods, involving either the CMB and/or BAO (with a specific focus on DESI publications), all favor a Universe expanding at ~67 km/s/Mpc. Although there are a few groups that have outlier values for distance ladder measurements (including the CCHP group, shown as the second-from-bottom point), the strongest measurements, from the SH0ES and Pantheon+ collaborations, for instance, favor a value of ~73 km/s/Mpc, as shown here with smaller error bars. The two sets of values disagree at more than 5-sigma significance.
Distance ladder
This is a fundamentally different way of measuring the Universe. The early relic method, remember, started from an early, imprinted signal with a length scale that expands as the Universe expands, and then we measure that scale at different epochs in cosmic history to draw conclusions about how the Universe has expanded over time. But with the distance ladder, what we do instead is the following.
- We start by measuring the distance to certain types of stars within our galaxy, directly, through a method known as parallax.
- Then we find those same types of stars in other relatively nearby galaxies, and use what we know about the nature and properties of those stars within our galaxy to draw conclusions about how far away those distant stars in other galaxies must be.
- Then, in those nearby galaxies, we look at other properties or events that occur within that galaxy, like its rotational properties, the brightness fluctuations along the surface, or even type Ia supernova events that have occurred within those galaxies, to “anchor” the stellar rung of the distance ladder to the cosmic one.
- And finally, we then use those same measured properties-or-events in more distant galaxies to infer how far away they are today.
By starting with known objects nearby, we can learn the distance-and-redshift to more distant objects, and progressively build out to greater and greater distances. With enough objects at a variety of distances, including ones that are sufficiently far away, we can draw conclusions about how fast the Universe has expanded.

The construction of the cosmic distance ladder involves going from our Solar System to the stars to nearby galaxies to distant ones. Each “step” carries along its own uncertainties, especially the steps where the different “rungs” of the ladder connect. However, recent improvements in the distance ladder have demonstrated how robust its results are.
The most accurate, and during the 21st century, what has become the now-standard method of constructing the distance ladder is simple, and involves only three rungs.
- Measure the distance to a certain type of star within the Milky Way, Cepheid variable stars, using stellar parallax.
- Identify and measure the brightnesses (over time) of stars of that same type, Cepheids, in other galaxies to the greatest distances possible, which teaches us their distance: and therefore the distance to their host galaxies.
- And finally, measure type Ia supernova events, the brightest “standard candles” found at the greatest distances, in those same galaxies that also have measured Cepheids and also at greater distances all across the Universe.
This is like the Olympic track & field event, the triple jump (hop, skip, and a jump), but on a cosmic scale. There was a herculean effort put forth in the 2000s and 2010s to reduce the uncertainties in all of these areas. Parallax improvements were made, and now enjoy a golden age thanks to the Gaia mission. Cepheids were searched for in a whole slew of nearby galaxies: including some out to distances of 50 million light-years. And global efforts were made to measure more and more type Ia supernovae were undertaken, including nearby and at great distances.

This graph shows the 1550 supernovae that are a part of the Pantheon+ analysis, plotted as a function of magnitude versus redshift. The supernova data, for many decades now (ever since 1998), has pointed toward a Universe that expands in a particular fashion that requires something beyond matter, radiation, and/or spatial curvature: a new form of energy that drives the expansion, known as dark energy. The supernovae all fall along the line that our standard cosmological model predicts, with even the highest-redshift, most far-flung type Ia supernovae adhering to this simple relation. Calibrating the relation without substantial error is of paramount importance.
The weakest rung
But there’s an inherent weakness to the distance ladder method, no matter how successful each “rung” is on its own: you have to stitch the different rungs together, and that’s often where the weak point is. In astronomy, any conclusions that you draw are dependent on an assumption that we usually gloss over: that your data is calibrated properly. Having a great slew of Cepheid measurements is great and having a great slew of type Ia supernova measurements is great as well. But if you want to construct a distance ladder out of them, you have to find objects where both objects/events exist. This means you need:
- galaxies that contain resolvable Cepheids (so you can get a reliable distance to them)
- and that also have been home to at least one observed type Ia supernova in them (so you can have a distance-plus-brightness combination for them).
The more galaxies you have that contain both classes of objects, the stronger the link (and the lower the uncertainty) between the different rungs of the ladder; the fewer galaxies you have that contain both classes of objects, the weaker the link is. In this particular case, connecting the rungs is difficult because type Ia supernova events are rare, as we’ve only spotted a few dozen in all the nearby galaxies (within ~100 million light-years) within our vicinity, and identifying individual stars within other galaxies is extremely difficult, even with Hubble and JWST.
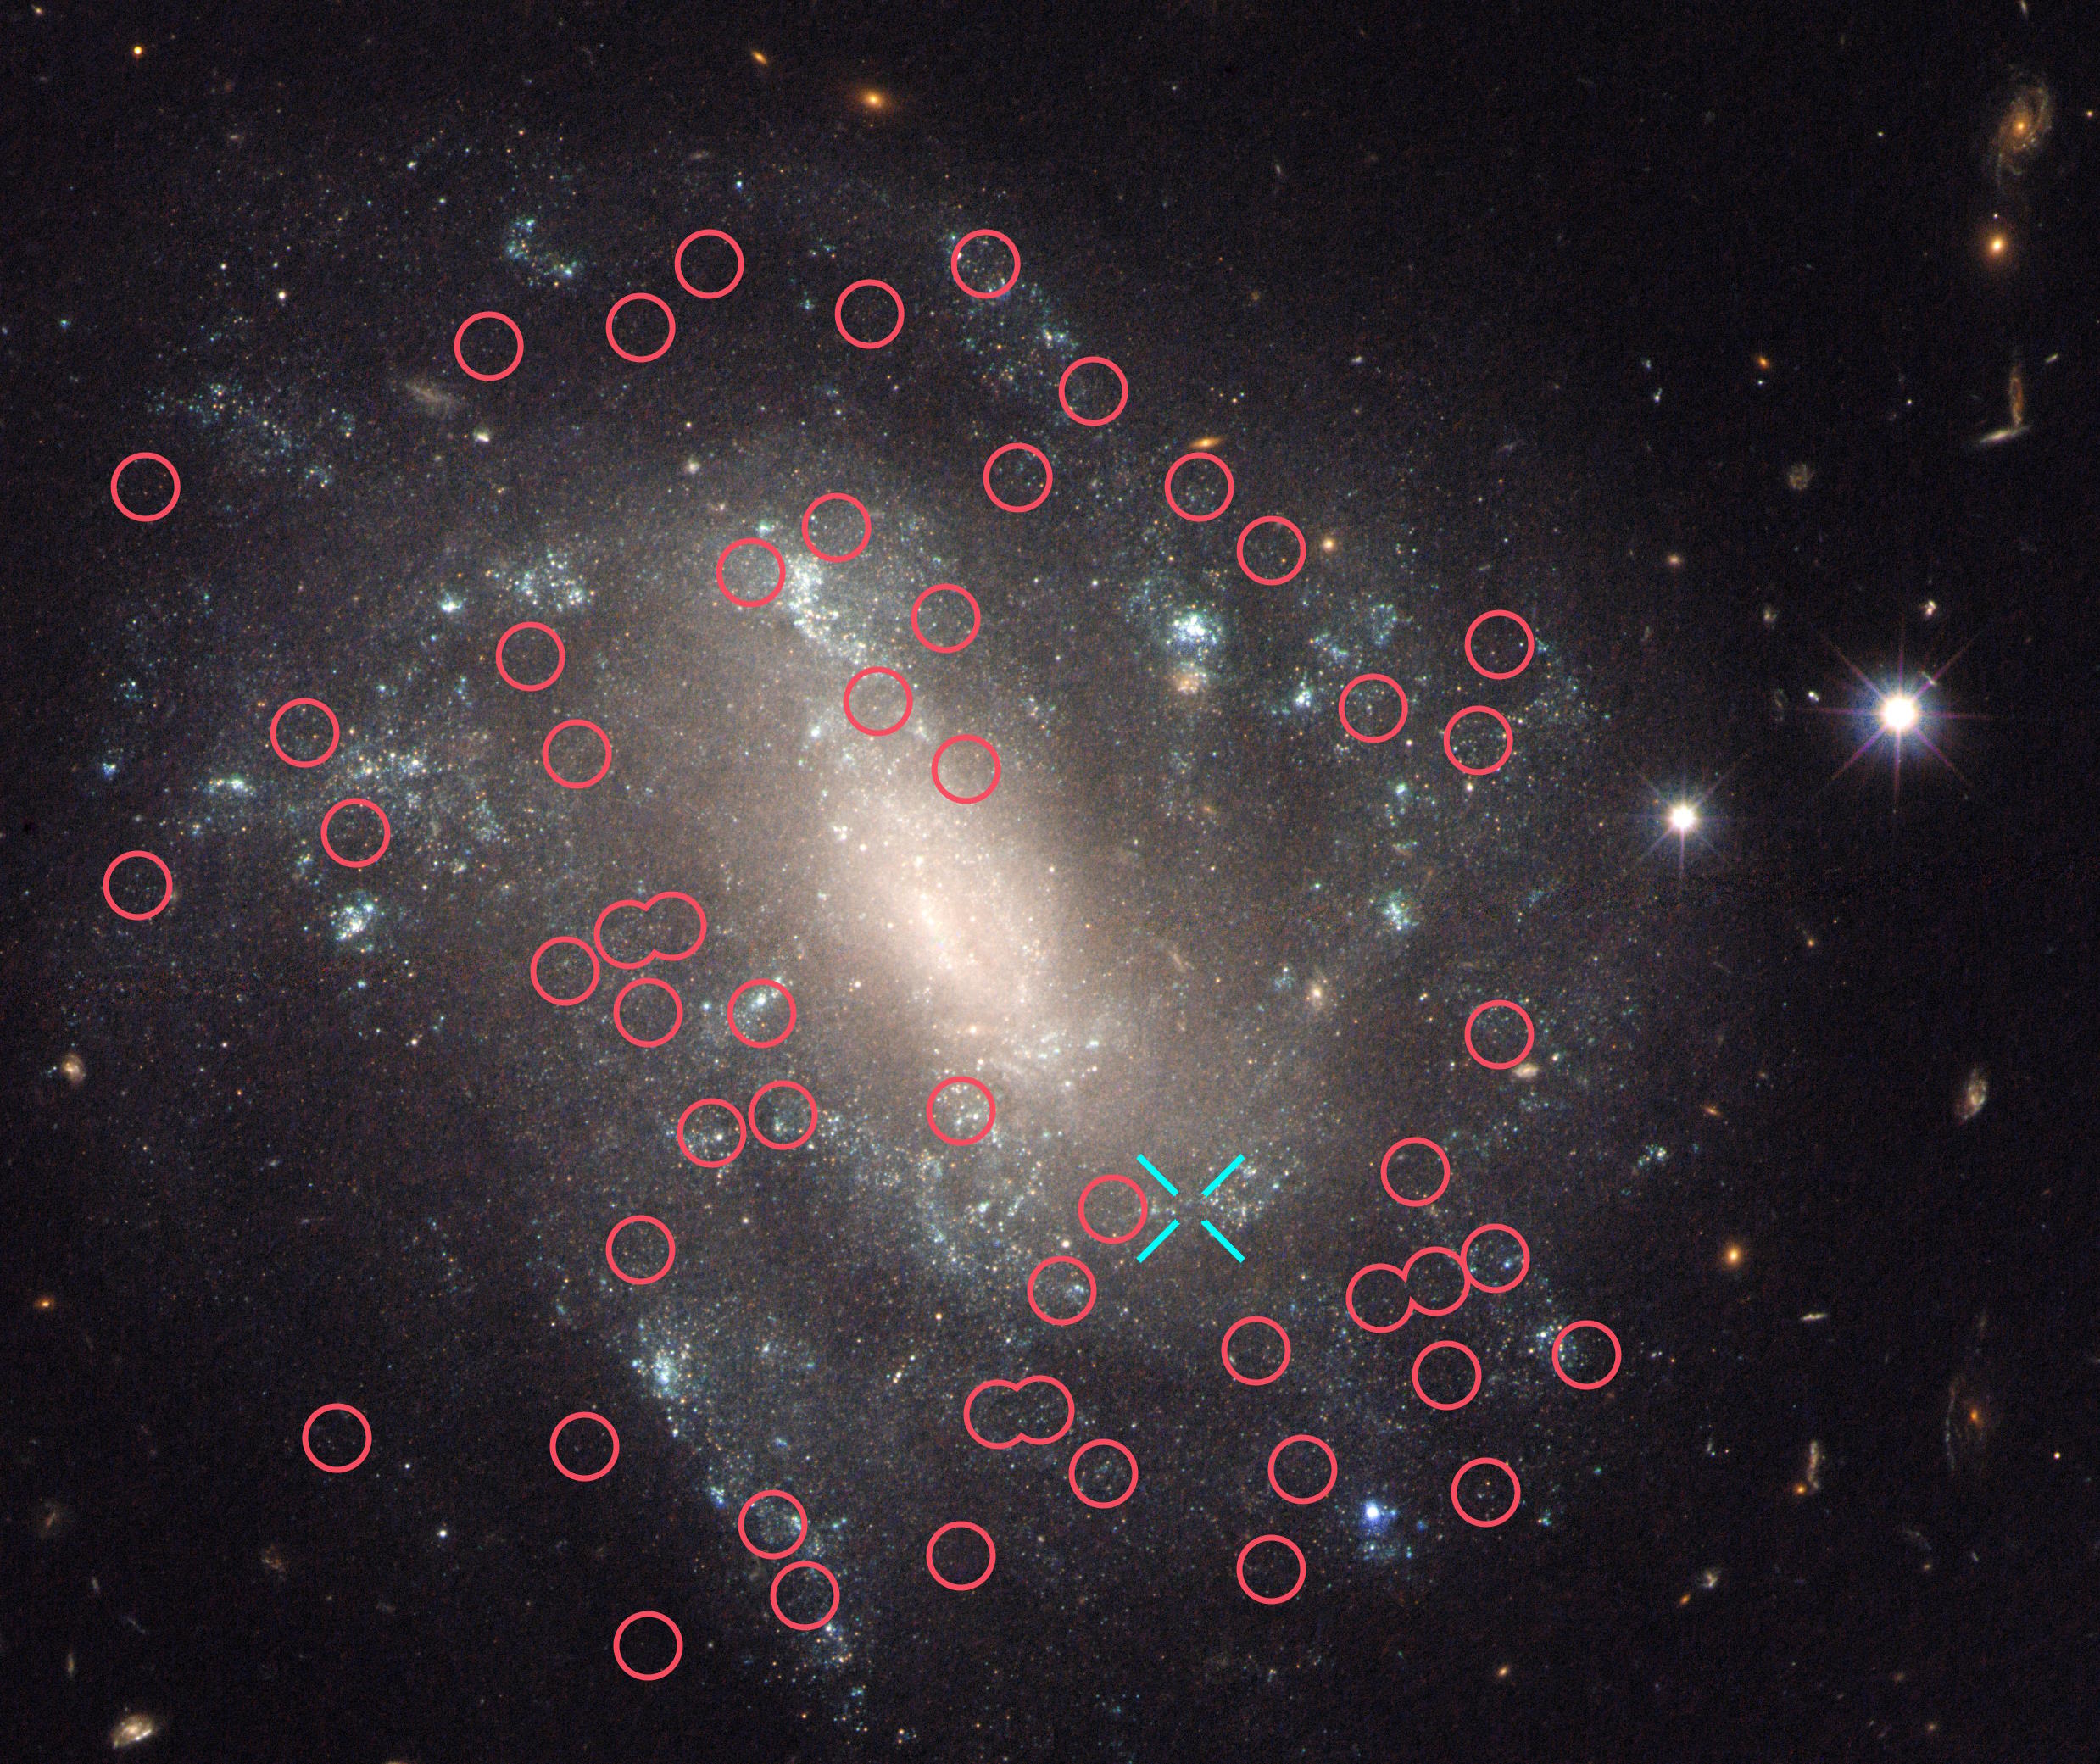
Spiral galaxy UGC 9391, shown here, is one of, at present, 42 important galaxies known to have housed a recently observed Type Ia supernova (blue cross) as well as several individual, resolvable Cepheid variable stars. Even a small uncertainty in a small sample of galaxies could bias these results toward artificially higher values, but a more comprehensive sample will reduce those errors tremendously.
In the 2010s, this “connection” between the star-based (Cepheid) rung and the more distant indicator’s (type Ia supernova’s) rung was known to be a weak point, as there were only 19 galaxies known to contain both. (I even wrote a story on it in 2019 myself.) However, in the subsequent time since then, the strength of that rung has been increased greatly. Today, there are more than double that: 42 known galaxies connect the star-based rung to the more distant rung, reducing the uncertainty from connecting them, at last, to below a 1% error. That improvement made cosmology’s biggest modern conundrum official, and a further potential source of uncertainty — the crowding of Cepheid variable stars in the field-of-view of Hubble — was demolished by spectacular new JWST data in 2023.
Every potential source of error that has ever been identified with this incarnation of the distance ladder, including (but not limited to):
- a Cepheid dependence on metallicity,
- a difference between galactic and extragalactic Cepheids,
- errors in the Gaia parallaxes,
- errors in the distances to the closest extragalactic Cepheids (in the Magellanic clouds),
- the unexpected presence of a new type of (grey?) dust,
- the possibility that we live in a giant void,
- or the evolution of large-distance, early-time supernovae or their environments,
has been analyzed and shown to only contribute as a possible source of error at the less-than-1% level. It’s only by getting to that remarkably high level of precision that we can justifiably declare that yes, there really is a significant tension between the two different classes of methods, the early relic method and the distance ladder method, for measuring how the Universe has expanded.
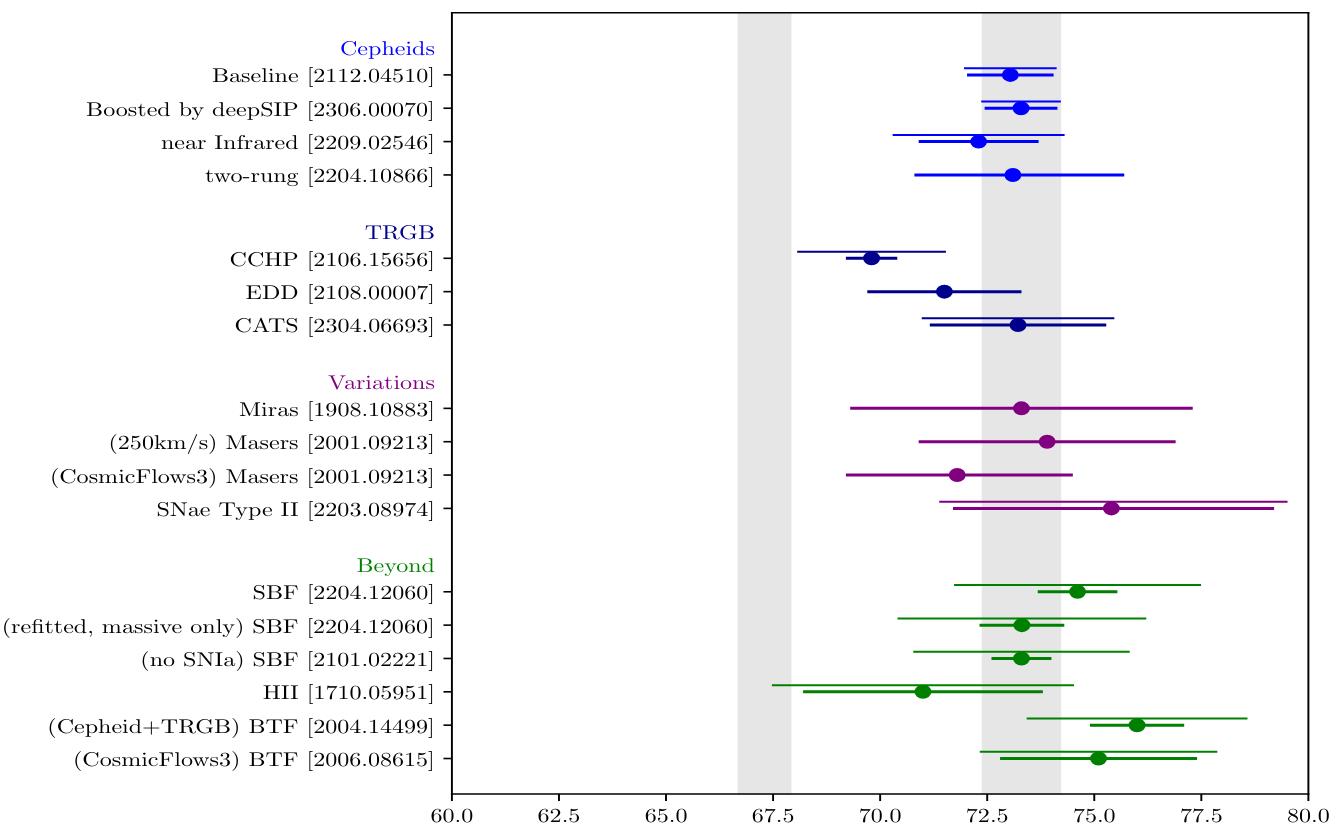
A 2023-era analysis of the various measurements for the expansion rate using distance ladder methods, dependent on which sample, which analysis, and which set of indicators are used. Note that the CCHP group, the only one to obtain a “low” value of the expansion rate, has not put out any new data since 2021 at present.
All other distance ladder methods have bigger errors
It’s true that this method of using a cosmic distance ladder would apply to not just parallax, Cepheids, and type Ia supernovae, but any indicators that worked this way. For example, instead of Cepheid variable stars, one could use RR Lyrae stars, Asymptotic Giant Branch (AGB) stars, or stars at the tip of the red giant branch (tRGB stars). Then, one could either continue to use type Ia supernovae, or one could choose to replace them with other extragalactic distance indicators: surface brightness fluctuations, galactic rotational/velocity dispersion properties, or even (dubiously) gamma-ray bursts, all of which can be found at great distances.

Travel the Universe with astrophysicist Ethan Siegel. Subscribers will get the newsletter every Saturday. All aboard!
The drawbacks, however, to using any other distance ladder method are tremendous. Cepheids have this nice property of being:
- intrinsically bright,
- ubiquitous,
- and reveal their intrinsic brightness just by measuring how their brightness fluctuates over the span of a few days.
We can find large numbers of Cepheids, individually, in galaxies up to 50-60 million light-years away. The other types of stars can only be measured reliably out to much smaller distances. Similarly, type Ia supernovae can be reliably measured out to the greatest distances of any of the indicators except gamma-ray bursts, and so far all attempts to “standardize” gamma-ray bursts have not been successful. Thus, the parallax plus Cepheid plus supernova ladder is the only one with uncertainties that are small enough to actually tell the difference between whether the expansion rate is 67 km/s/Mpc or 73 km/s/Mpc.
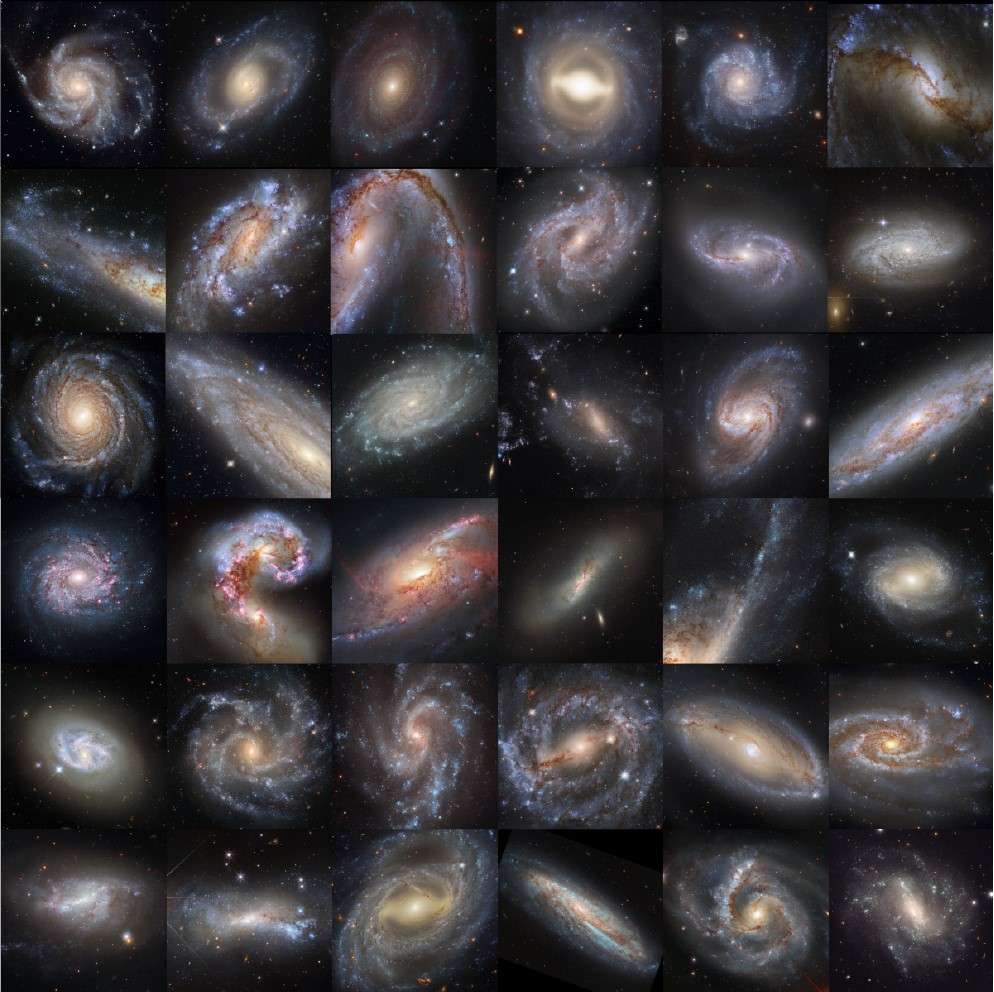
As recently as 2019, there were only 19 published galaxies that contained distances as measured by Cepheid variable stars that also were observed to have type Ia supernovae occur in them. We now have distance measurements from individual stars in galaxies that also hosted at least one type Ia supernova in 42 galaxies, 35 of which have excellent Hubble imagery. Those 35 galaxies are shown here. On the other hand, fewer than a dozen have identified individual tRGB stars within them.
The new claims from the “CCHP” group, asserting that the Hubble tension can be resolved by an in-between value for the expansion rate, are very troublesome for two reasons. First, there isn’t even a paper (not even an unpublished preprint) to refer to, where others in the community can see their work. But secondly and perhaps even more importantly, their “weak connection” between the stellar rung (tip of the red giant branch stars) and the extragalactic rung (also using type Ia supernovae) only has between 8-to-10 galaxies where both appear. In other words, they use a smaller sample, biased toward closer galaxies, with greater uncertainties inherent to them, to argue that the group using a larger, better, less biased sample (which includes all of the galaxies in the CCHP group’s sample) is wrong.
It’s a bit like looking at an asteroid that will pass near the Earth, calculating its orbit, and noting that it will come close to, but miss, our planet. However, if you were to:
- blur your own vision sufficiently,
- or use insufficiently accurate tools,
- or collect data over too short of a period of time,
you would incorrectly conclude that there was a very real possibility that the Earth was at risk of being struck. This actually happened routinely in the late 1990s and early 2000s, when the Torino scale was first adopted.
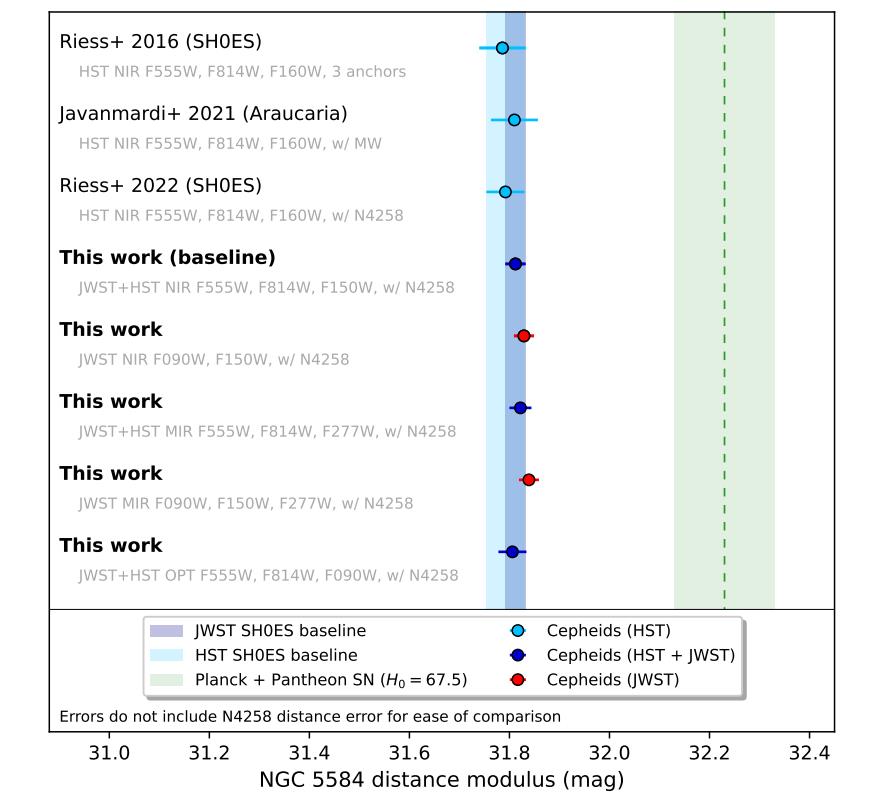
By enabling a better understanding of Cepheid variables in nearby galaxies NGC 4258 and NGC 5584, JWST has reduced the uncertainties in their distances even further. The lowest points on the graph show the estimate for the distance to NGC 5584 from the expansion rates inferred from the distance ladder (left side) and what’s expected from the early relic method (right side). The mismatch is significant and compelling, and the uncertainties are tiny compared to the differences between the two methods.
It may yet turn out that there’s a mundane resolution to the problem of the Hubble tension, but it won’t come from a poorer set of measurements. If, for example, the SH0ES team (which is the current best distance ladder measurement) restricted their sample to:
- the same small supernova sample as the CCHP study,
- the same anchor as the CCHP study,
- and the same “connecting” galaxies between the stellar and extragalactic rungs as the CCHP study,
they would have achieved a similar value for the expansion rate: 70 km/s/Mpc, with an uncertainty of 2.3 km/s/Mpc. It’s the same analogy, but you don’t learn anything new by proverbially blurring your own vision, other than the extent of how important making sufficiently precise, comprehensive measurements is.
The lesson is that you must first achieve a certain level of precision to your measurements before drawing meaningful conclusions. The parallax-Cepheid-supernova distance ladder method has achieved that precision, whereas none of the other distance ladder methods, including the CCHP group, have done so. If any other group using any other method — whether a different distance ladder method, a “standard siren” method, a “cosmic chronometer” method, or even a new early relic method — wants to be competitive, their first order of business is to improve their uncertainties so that their errors are significantly smaller than the difference between the current early relic and distance ladder values. Until that day arrives, the Hubble tension will remain, and will remain unrelaxed by new, less-precise measurements.

Dr. Thomas Hughes is a UK-based scientist and science communicator who makes complex topics accessible to readers. His articles explore breakthroughs in various scientific disciplines, from space exploration to cutting-edge research.


