- XRP’s Fear and Greed index flashed ‘fear’
- Market indicators and metrics pointed to a trend reversal
Most cryptos had a rough week as their weekly charts remained red, and XRP was no different. The drop in price might have sparked fear among investors too. However, things can take a U-turn in the coming days as a bullish pattern seems to be appearing on the token’s daily chart.
A bull pattern on XRP’s chart
According to CoinMarketCap, XRP investors didn’t earn profits last week as the token’s price dropped by more than 4%. At the time of writing, the altcoin was trading at $0.4775 with a market capitalization of over $26.5 billion. Thanks to the price drop, XRP’s profit supply in profit also plummeted sharply.
At press time, only 69.8 billion tokens were in profit. However, investors must not lose hope as XRP might be getting ready for a pump. In fact, AMBCrypto’s analysis revealed that a bullish falling wedge pattern has emerged on the token’s chart.
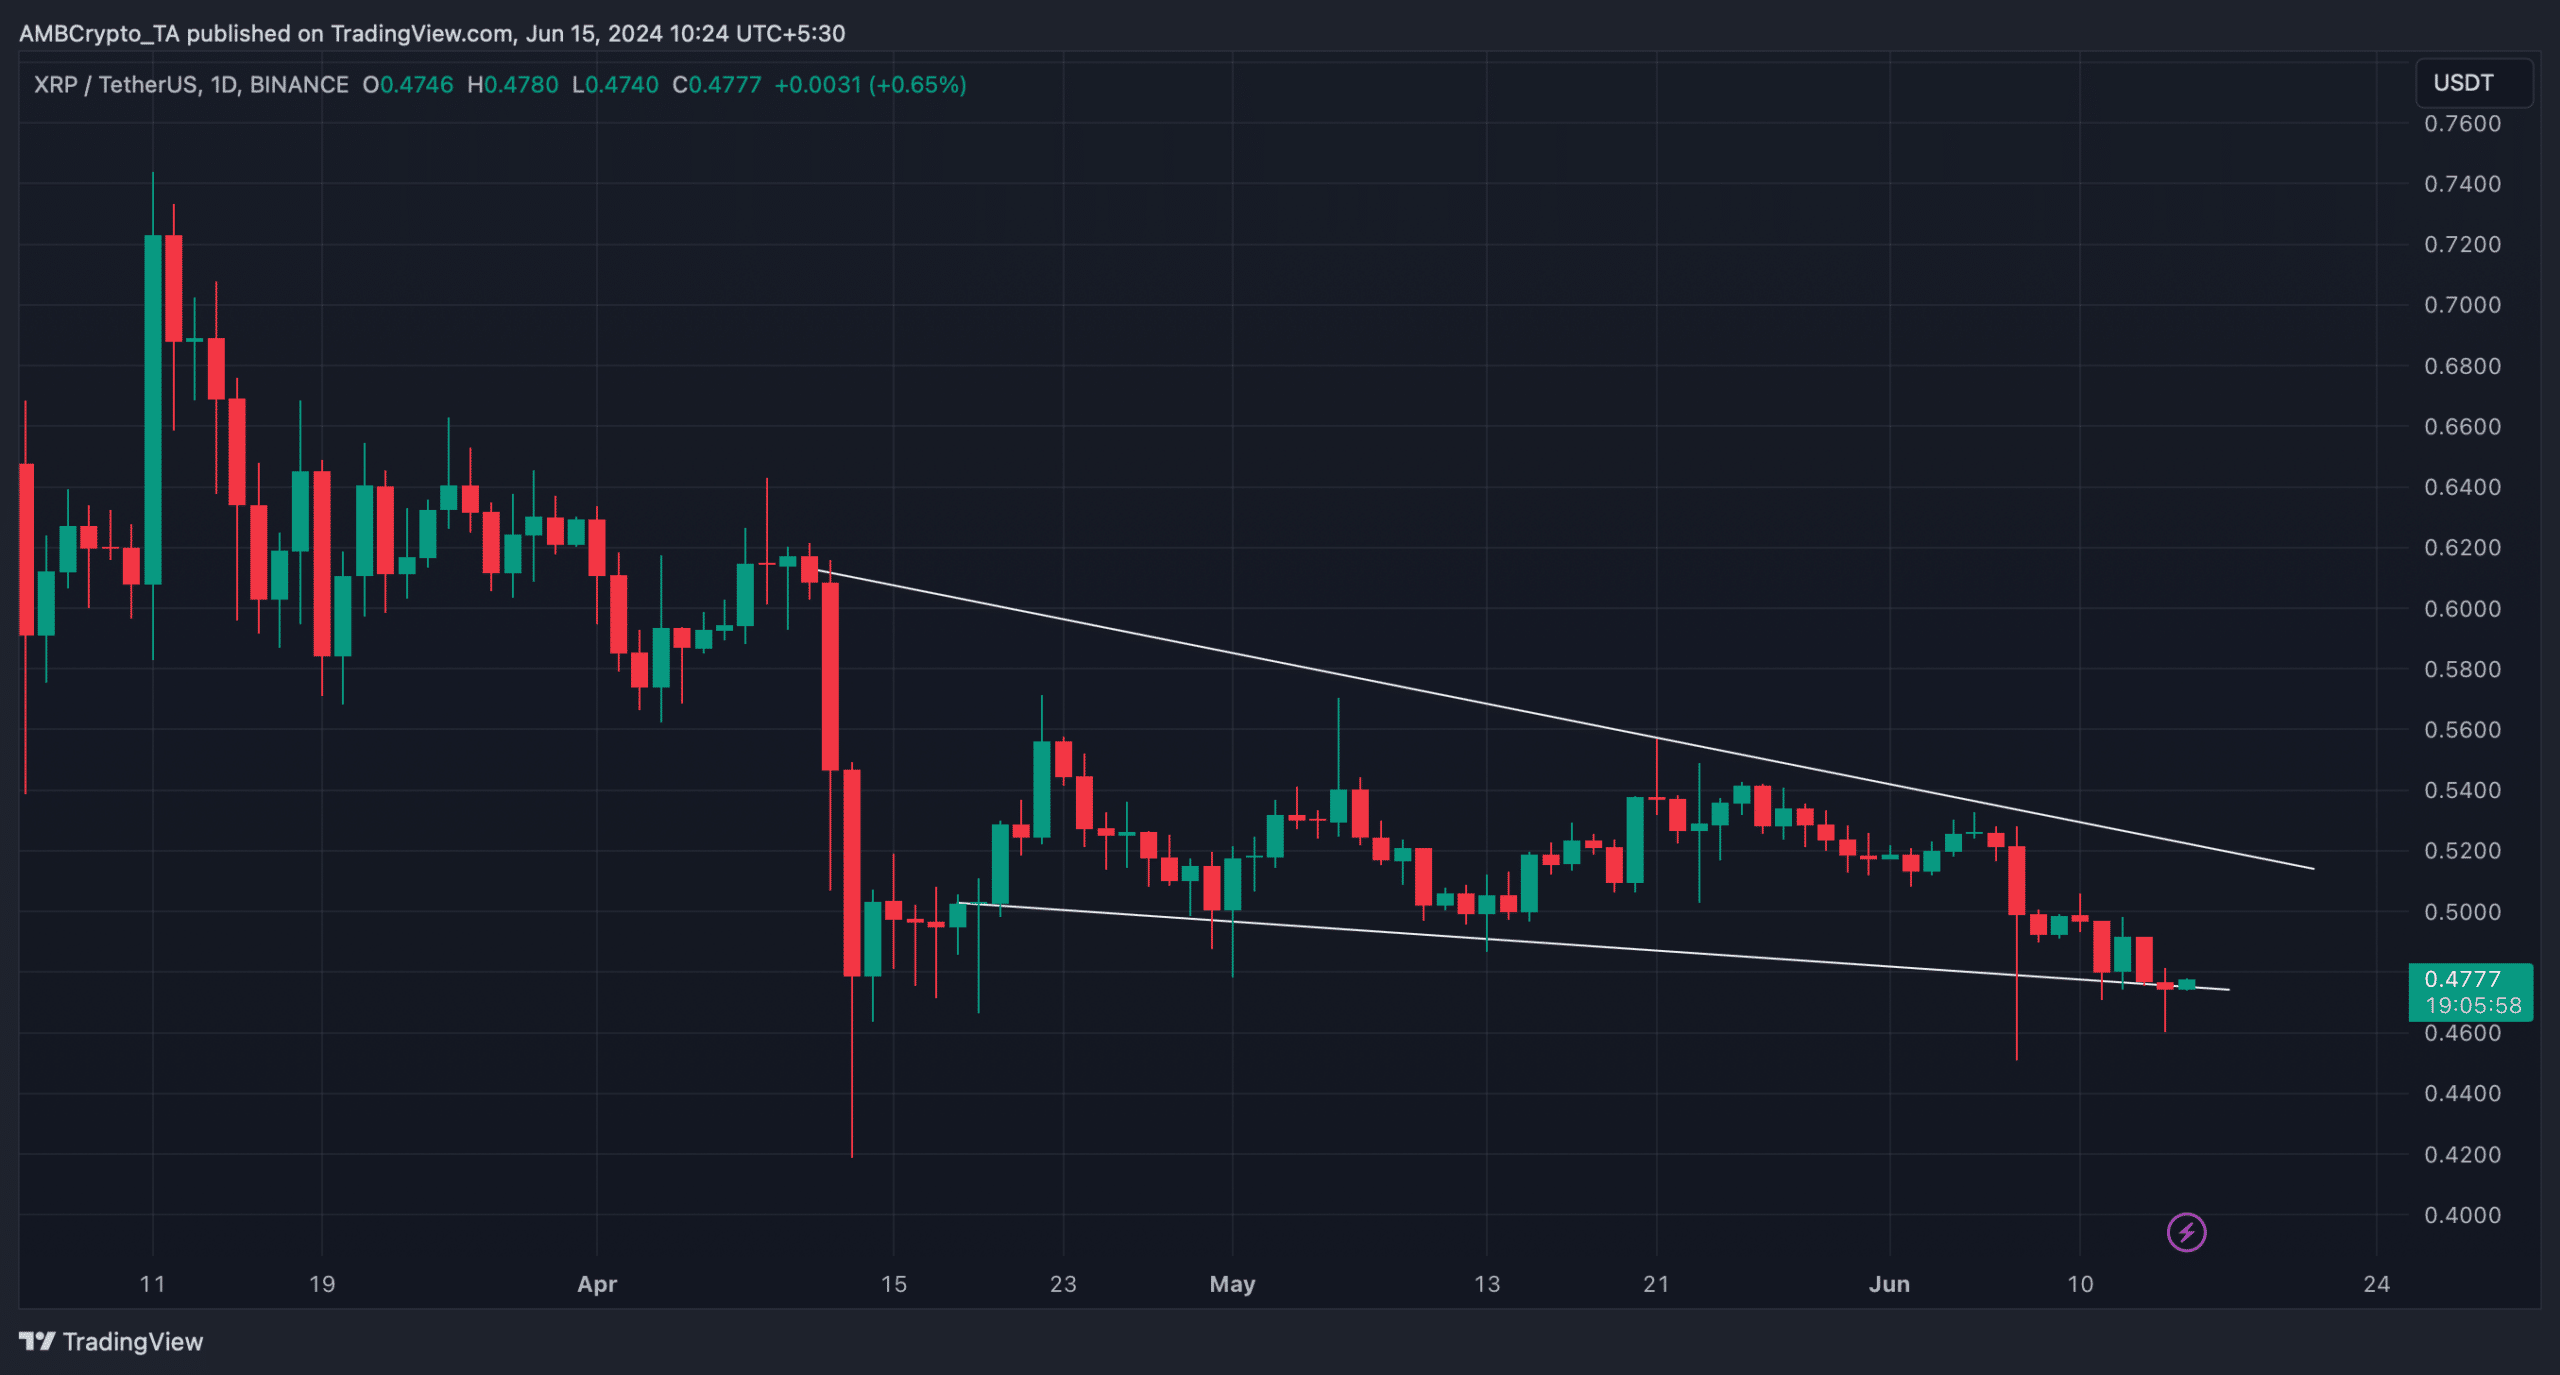
Source: TradingView
XRP’s price entered the pattern after its massive price fall in mid-April. Since then, the token has consolidated inside the falling wedge. At press time, it was preparing for an uptrend, which might result in a breakout above the pattern. A successful breakout might allow XRP to recover its April losses.
In fact, if everything falls into place, then XRP might soon retest its March highs too.
Is a bull rally inevitable?
AMBCrypto then analyzed Santiment’s data to see whether metrics supported the possibility of a bullish breakout. We found that XRP’s MVRV ratio was at its lowest point in the last 30 days, which might trigger a bull rally.
Its supply on exchanges dipped too, meaning that investors used the opportunity to buy more tokens. Additionally, whale activity around XRP also remained relatively high, with the same evidenced by its whale transaction count.

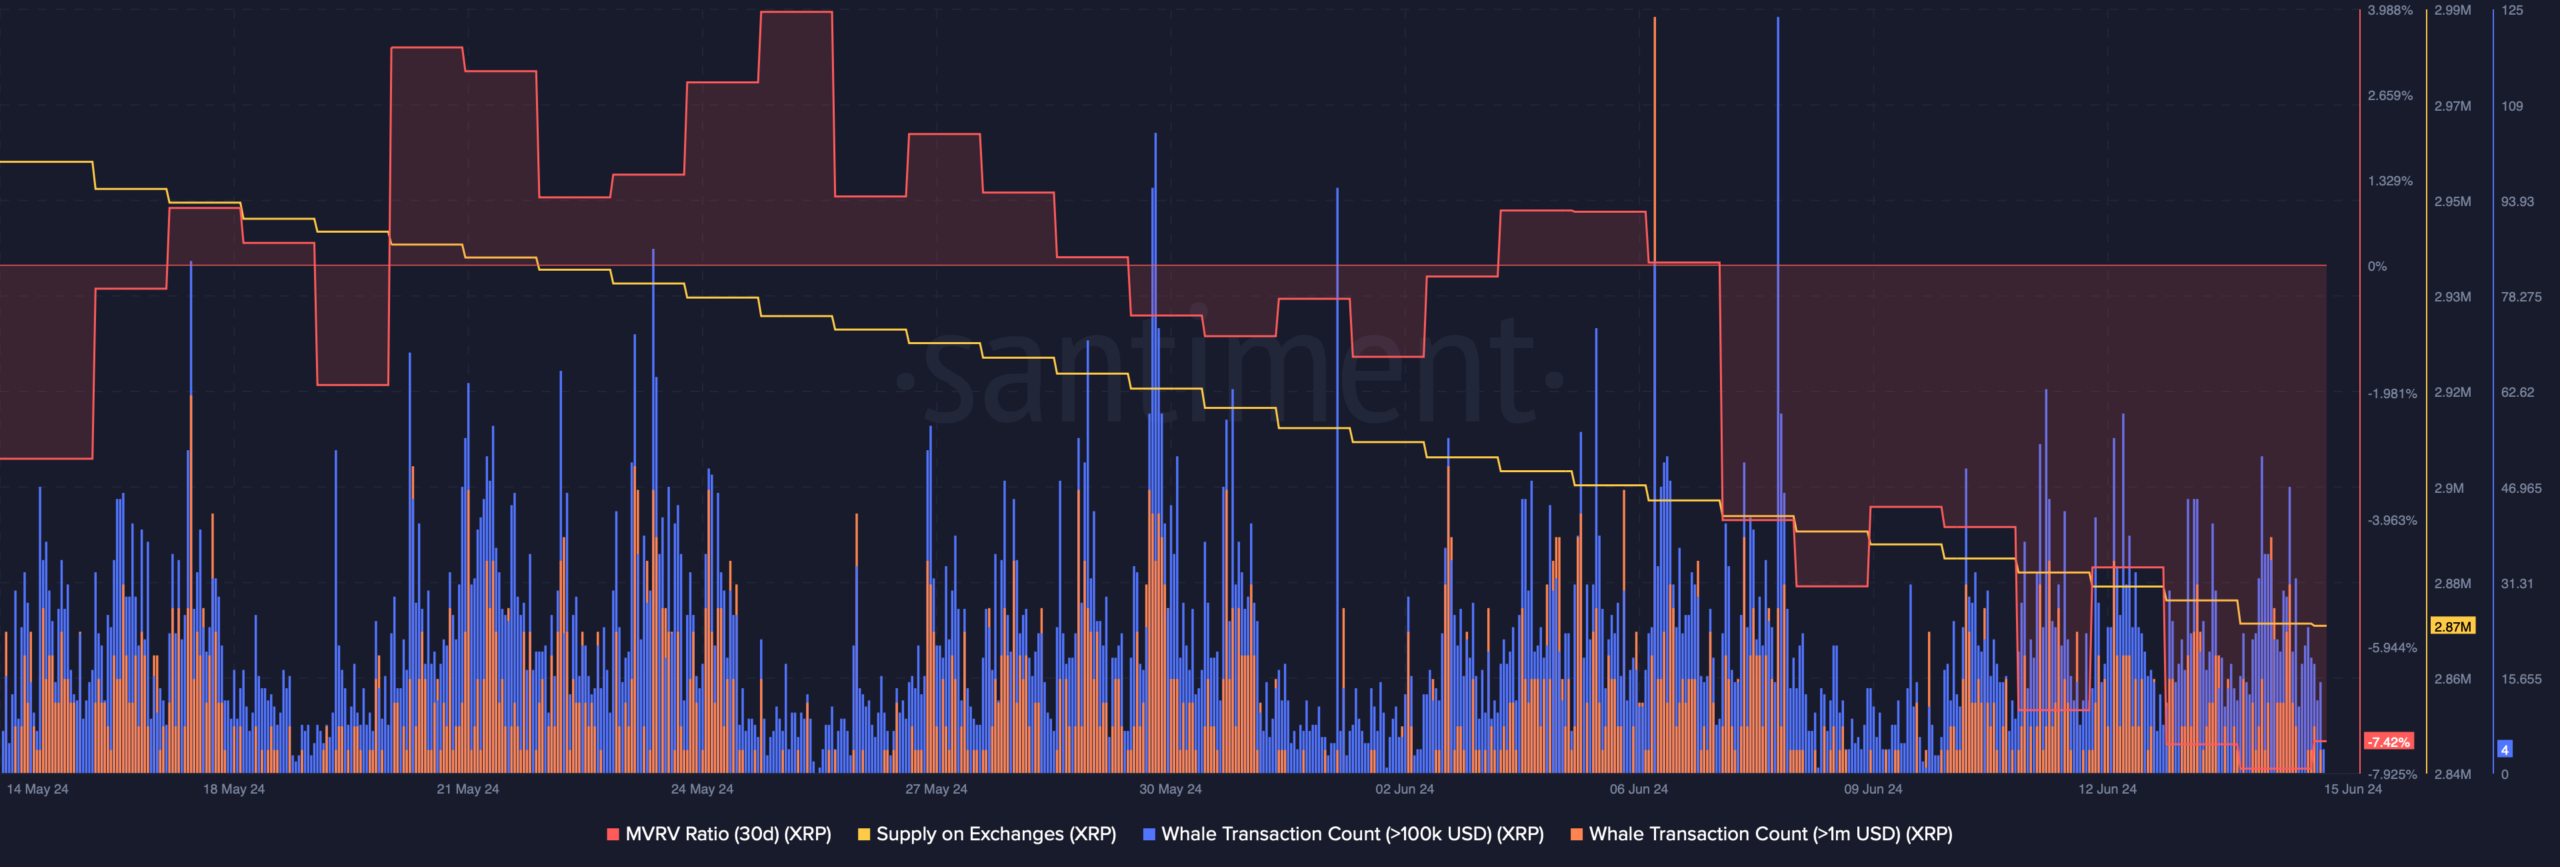
Source: Santiment
Additionally, AMBCrypto found that at press time, XRP’s fear and greed index had a value of 37%, meaning that the market was in a “fear” phase. Whenever the metric hits that level, it indicates that the chances of a trend reversal are high.
We then analyzed the token’s daily chart to better understand what to expect from it in the coming days. AMBCrypto found that XRP’s price has touched the lower limit of the Bollinger Bands, which often results in price upticks.
Realistic or not, here’s XRP’s market cap in BTC terms
Moreover, both its Relative Strength Index (RSI) and Chaikin Money Flow (CMF) registered slight upticks.
These indicators suggested that the chances of a bullish trend reversal were high. Worth noting, however, that the MACD remained in the sellers’ favor as it projected a bearish advantage across the market.

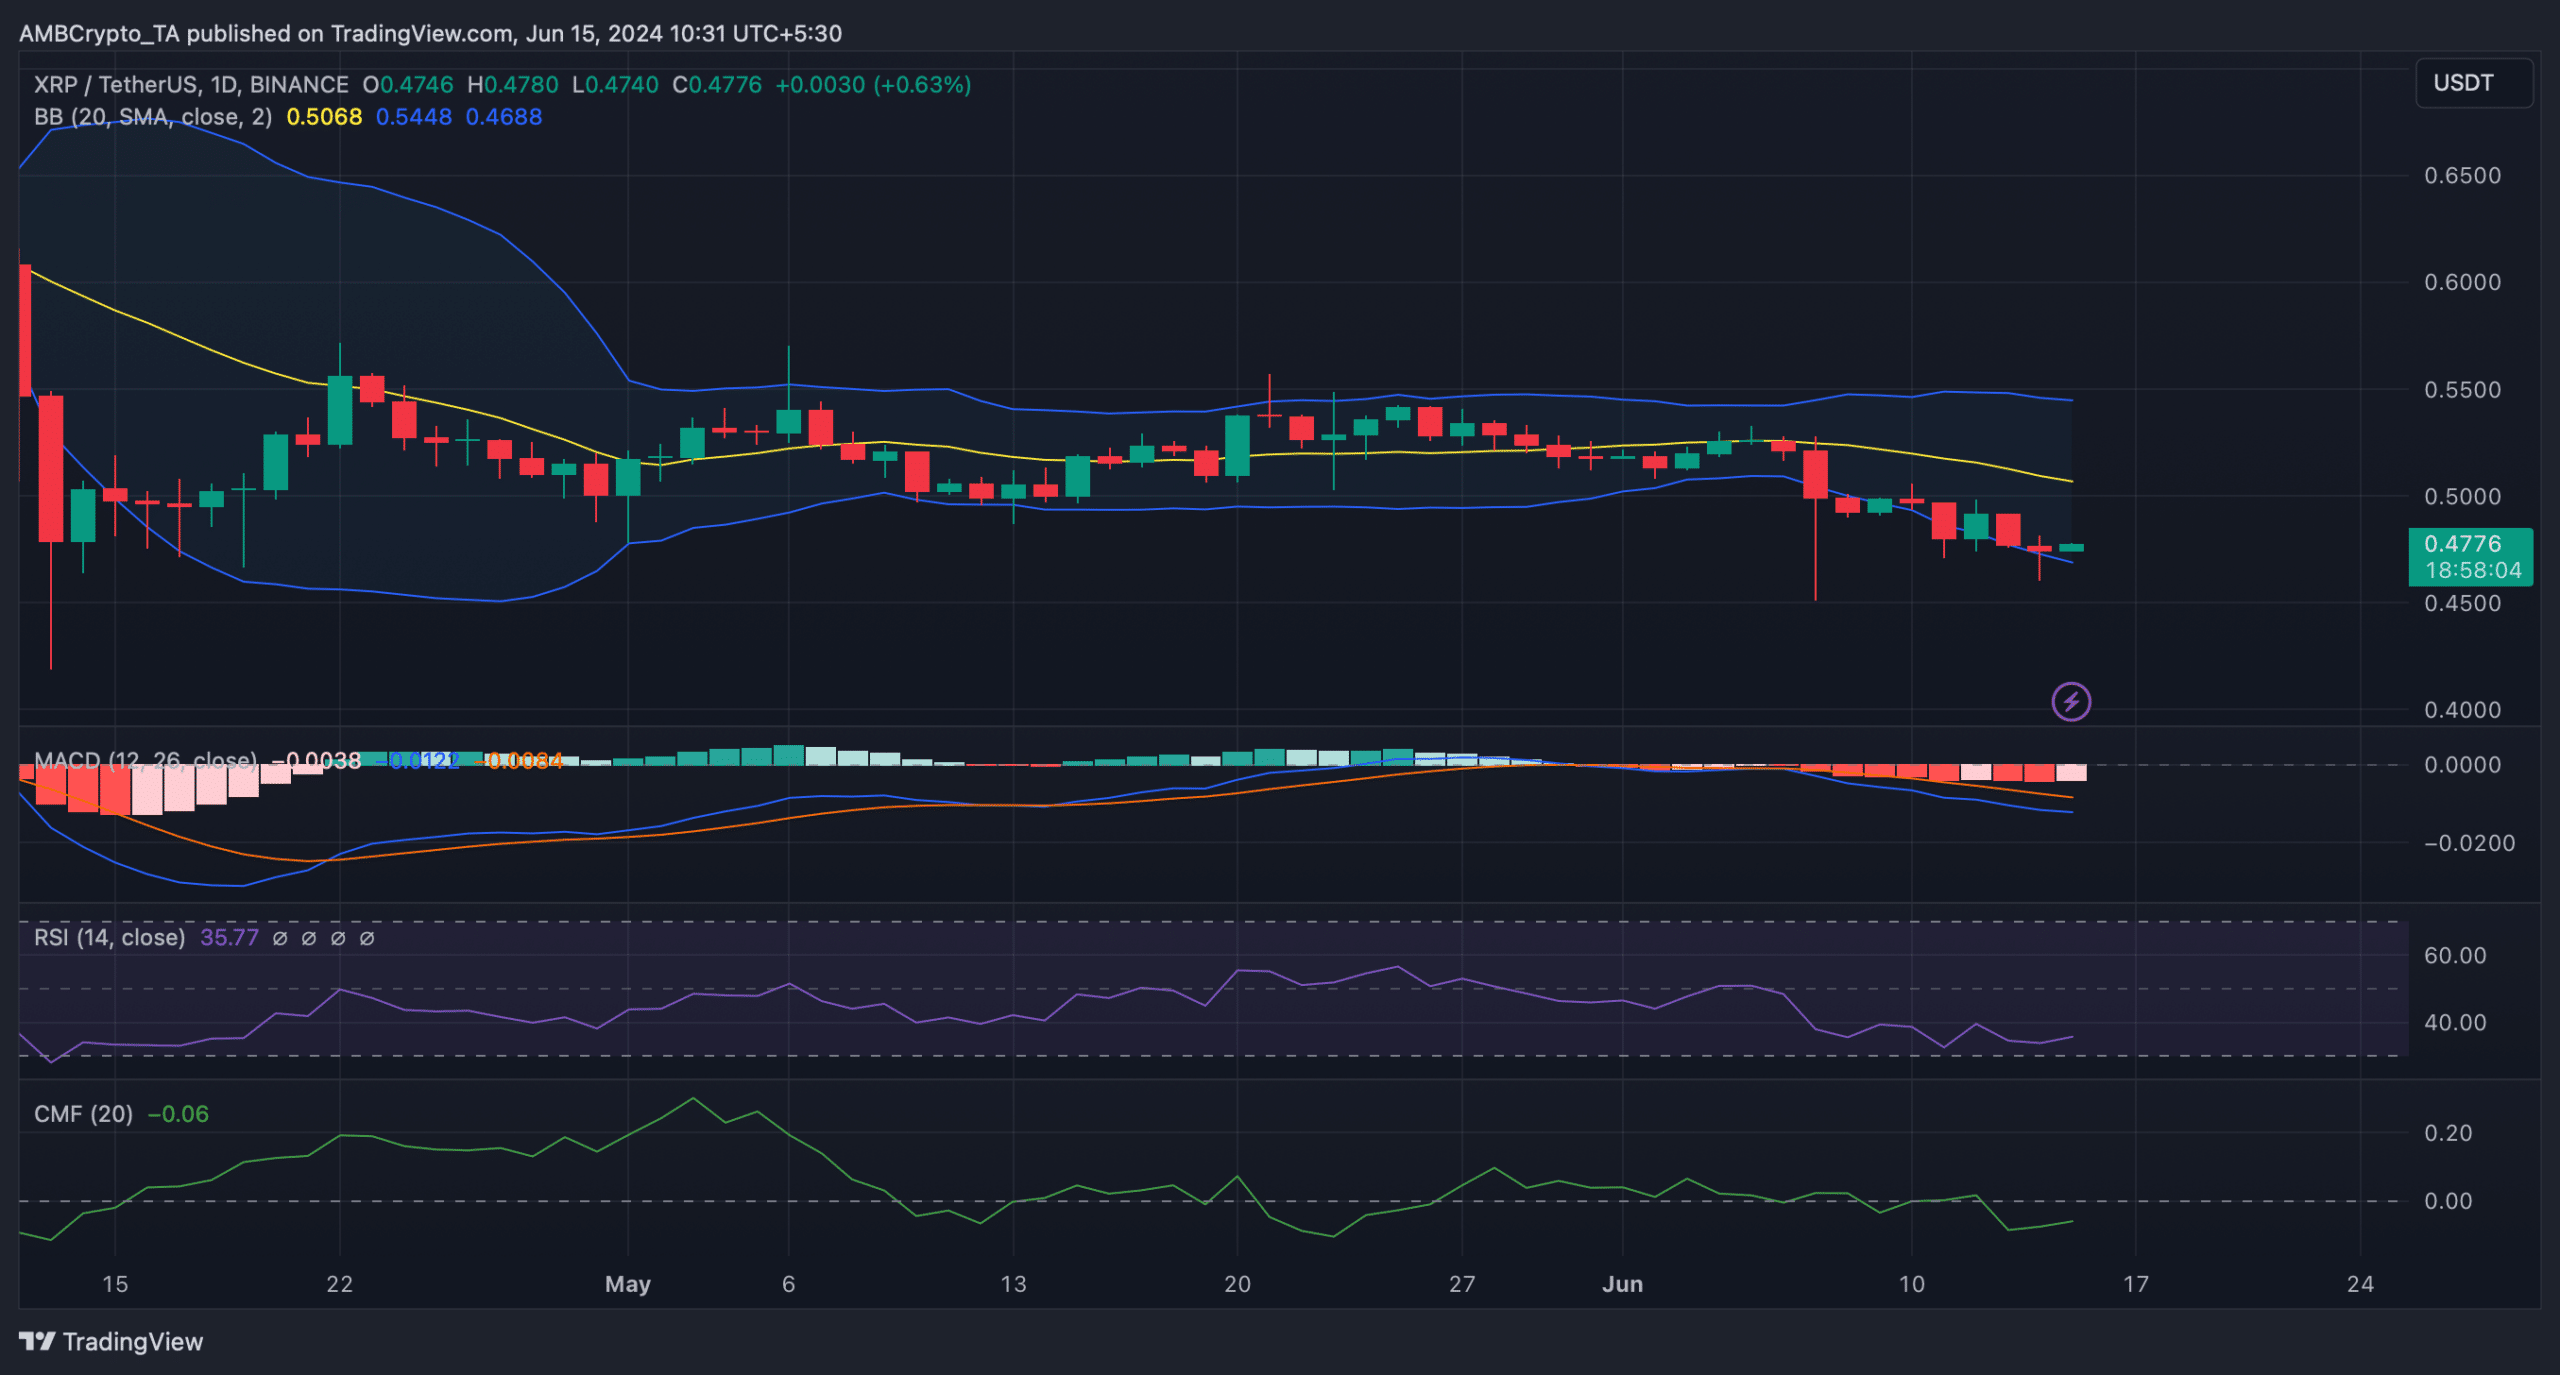
Source: TradingView

Robert Johnson is a UK-based business writer specializing in finance and entrepreneurship. With an eye for market trends and a keen interest in the corporate world, he offers readers valuable insights into business developments.


