
- Mog Coin flipped BOME by market capitalization, rising over 100% in the past week.
- Technical indicators suggested potential overbought conditions for Mog Coin’s current price rally.
Ethereum [ETH] memecoin Mog Coin [MOG] has been experiencing a notable increase in value, with its price rising by 10.31% in the past 24 hours to $0.000001922, per CoinMarketCap.
The market cap has similarly surged by 8.92%, reaching $692.62 million, placing it at rank #97.
Despite this positive price movement, the daily trading volume has decreased by 32.98% to $53.47 million. Hence, while investor confidence rose, trading activity declined, indicating possible consolidation.
Ethereum’s MOG flips Solana’s BOME
MOG Coin recently flipped BOOK OF MEME [BOME] while showcasing a surge of over 115% in the past week. This impressive performance has propelled MOG to become one of the top-performing meme coins.
Speculation is rising about whether MOG will also surpass BONK, driven by renewed interest in the Solana [SOL] ecosystem and positive developments in the crypto ETF space.
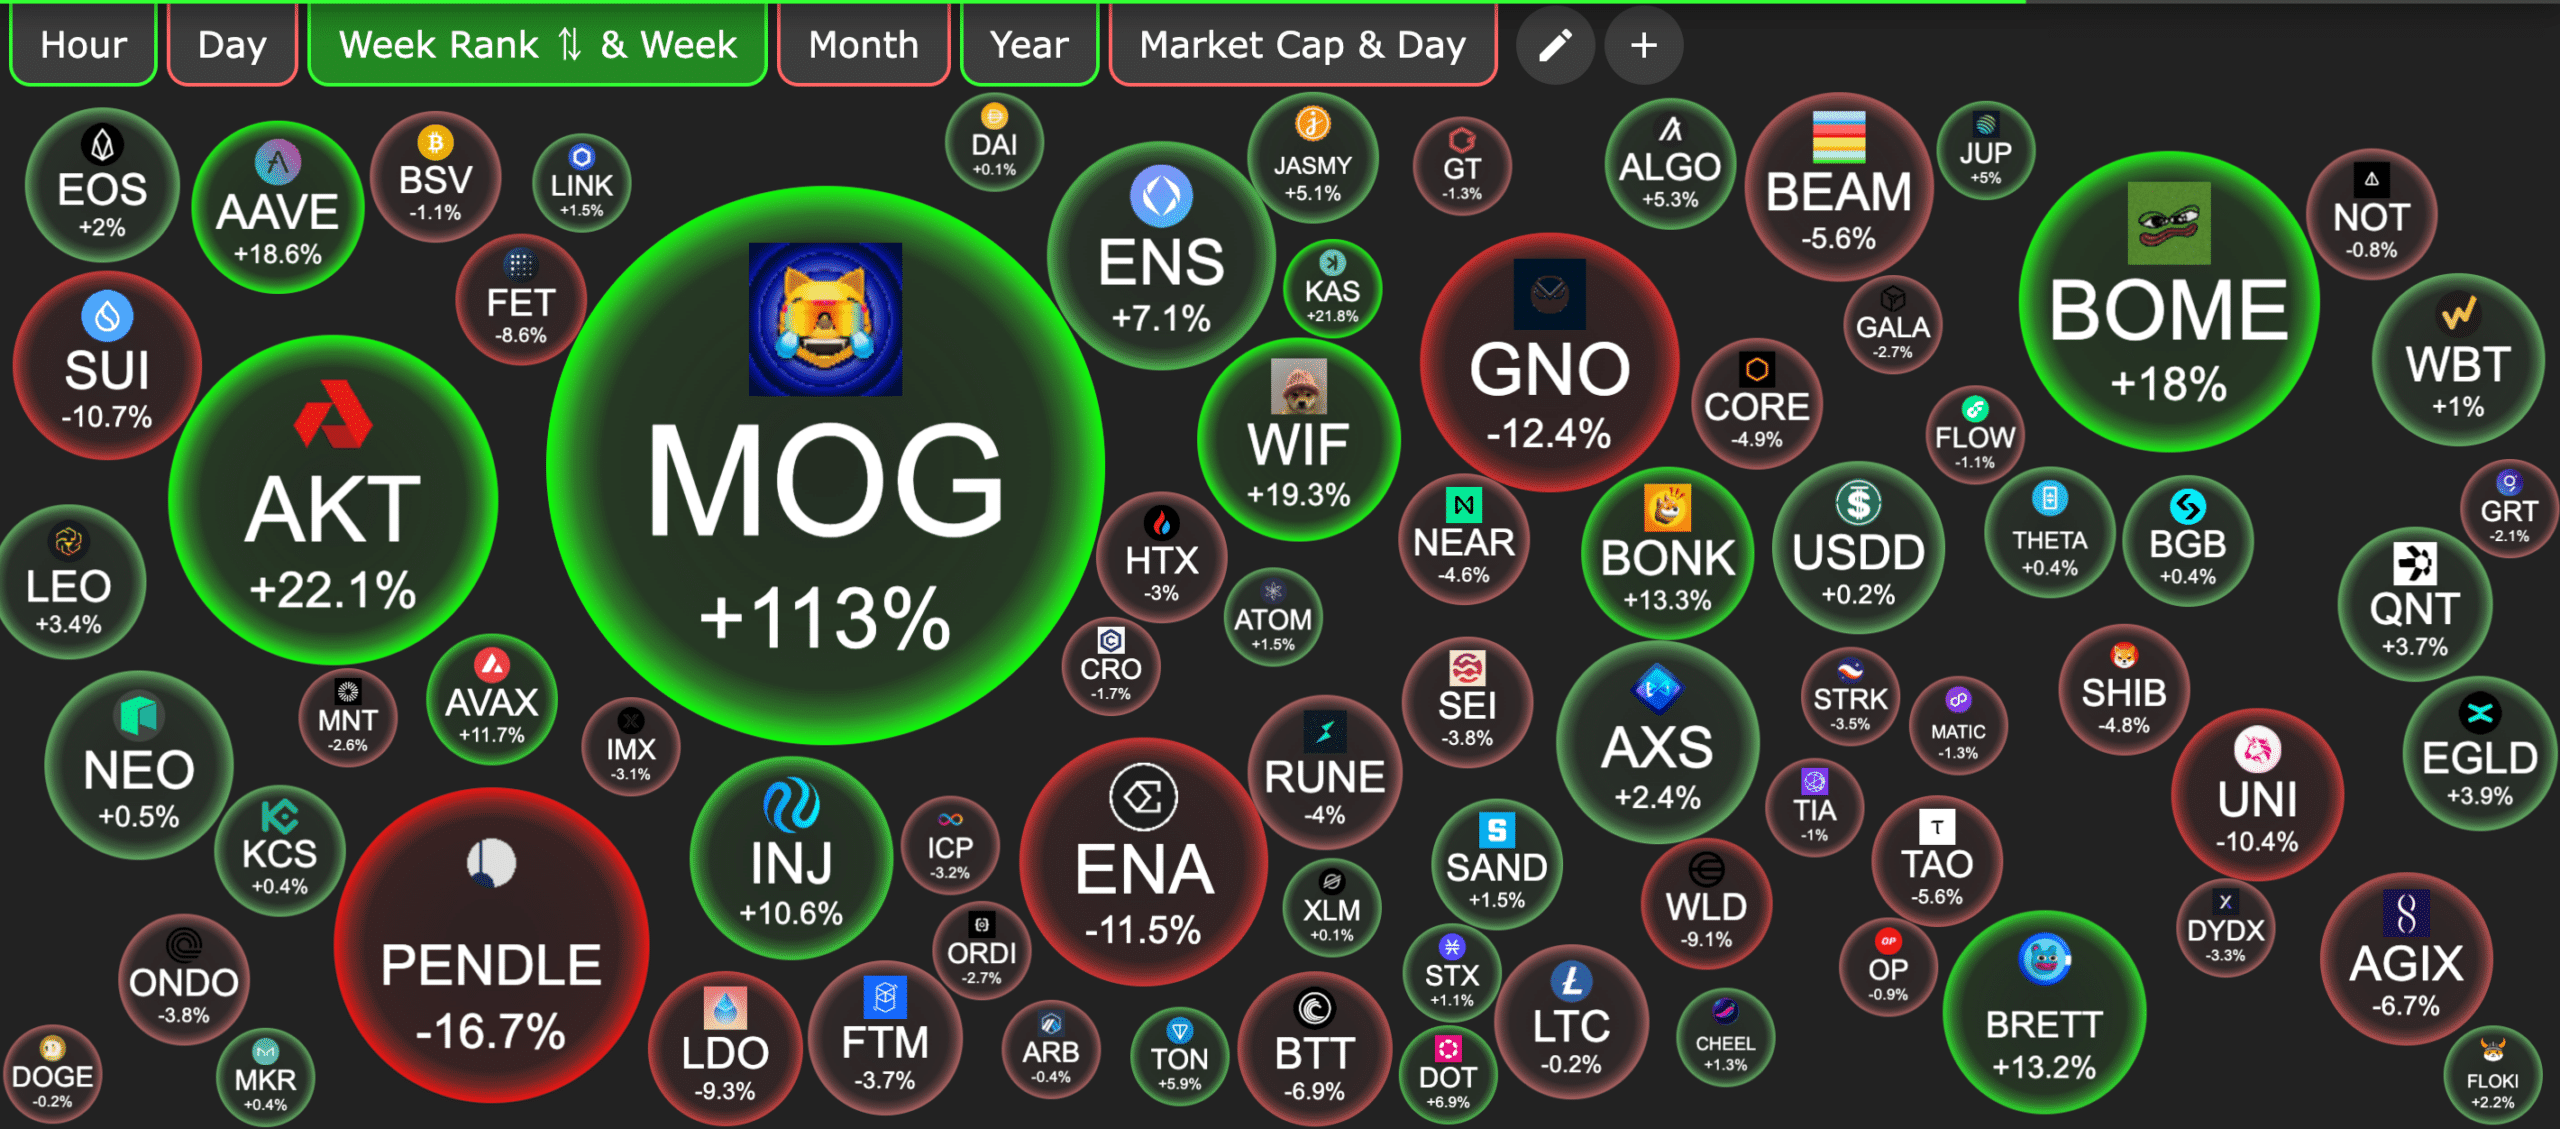
Source: Crypto Bubbles
OSF, a figure in the crypto space, commented that MOG’s growth over the past year exemplified a well-executed memecoin strategy.
This community-driven momentum has been a crucial factor in MOG’s rapid ascent in the market.
Similarly, Eddie, a crypto trader on X (formerly Twitter), remarked,
“$MOG still holding up, getting lots of timeline mentions & main mog homies like @kmoney_69 doubling down on memeing the token.”
He added,
“I opened a trade around here, wide stop loss and looking for momentum to continue. I will close my trade if the market breaks down or MOG chart shows weakness.”

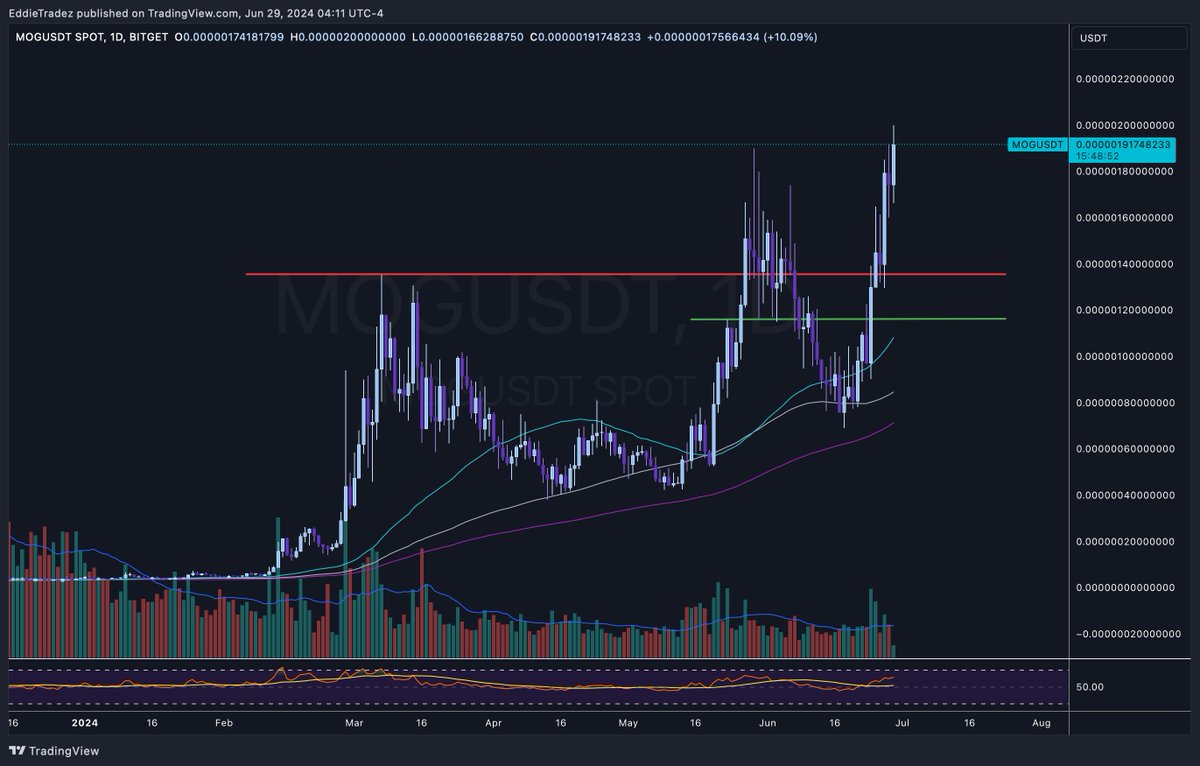
Source: Eddie/X
Technical analysis and market indicators
The price chart for Mog Coin showed a rising wedge pattern at press time, indicating potential upward momentum in the short term.
The Bollinger Bands suggested that MOG was experiencing volatility, with the price hovering near the upper band, often signifying overbought conditions.
The current levels were significantly above the moving average, reinforcing the bullish sentiment.
At press time, the Relative Strength Index (RSI) was at 70.10, entering the overbought territory, which could signal a potential pullback or consolidation soon.
The Commodity Channel Index (CCI) was also in a high range at 114.29, further suggesting that MOG might be overextended.
Traders should watch for any bearish divergence or a break below the rising wedge pattern, which could indicate a reversal or correction.

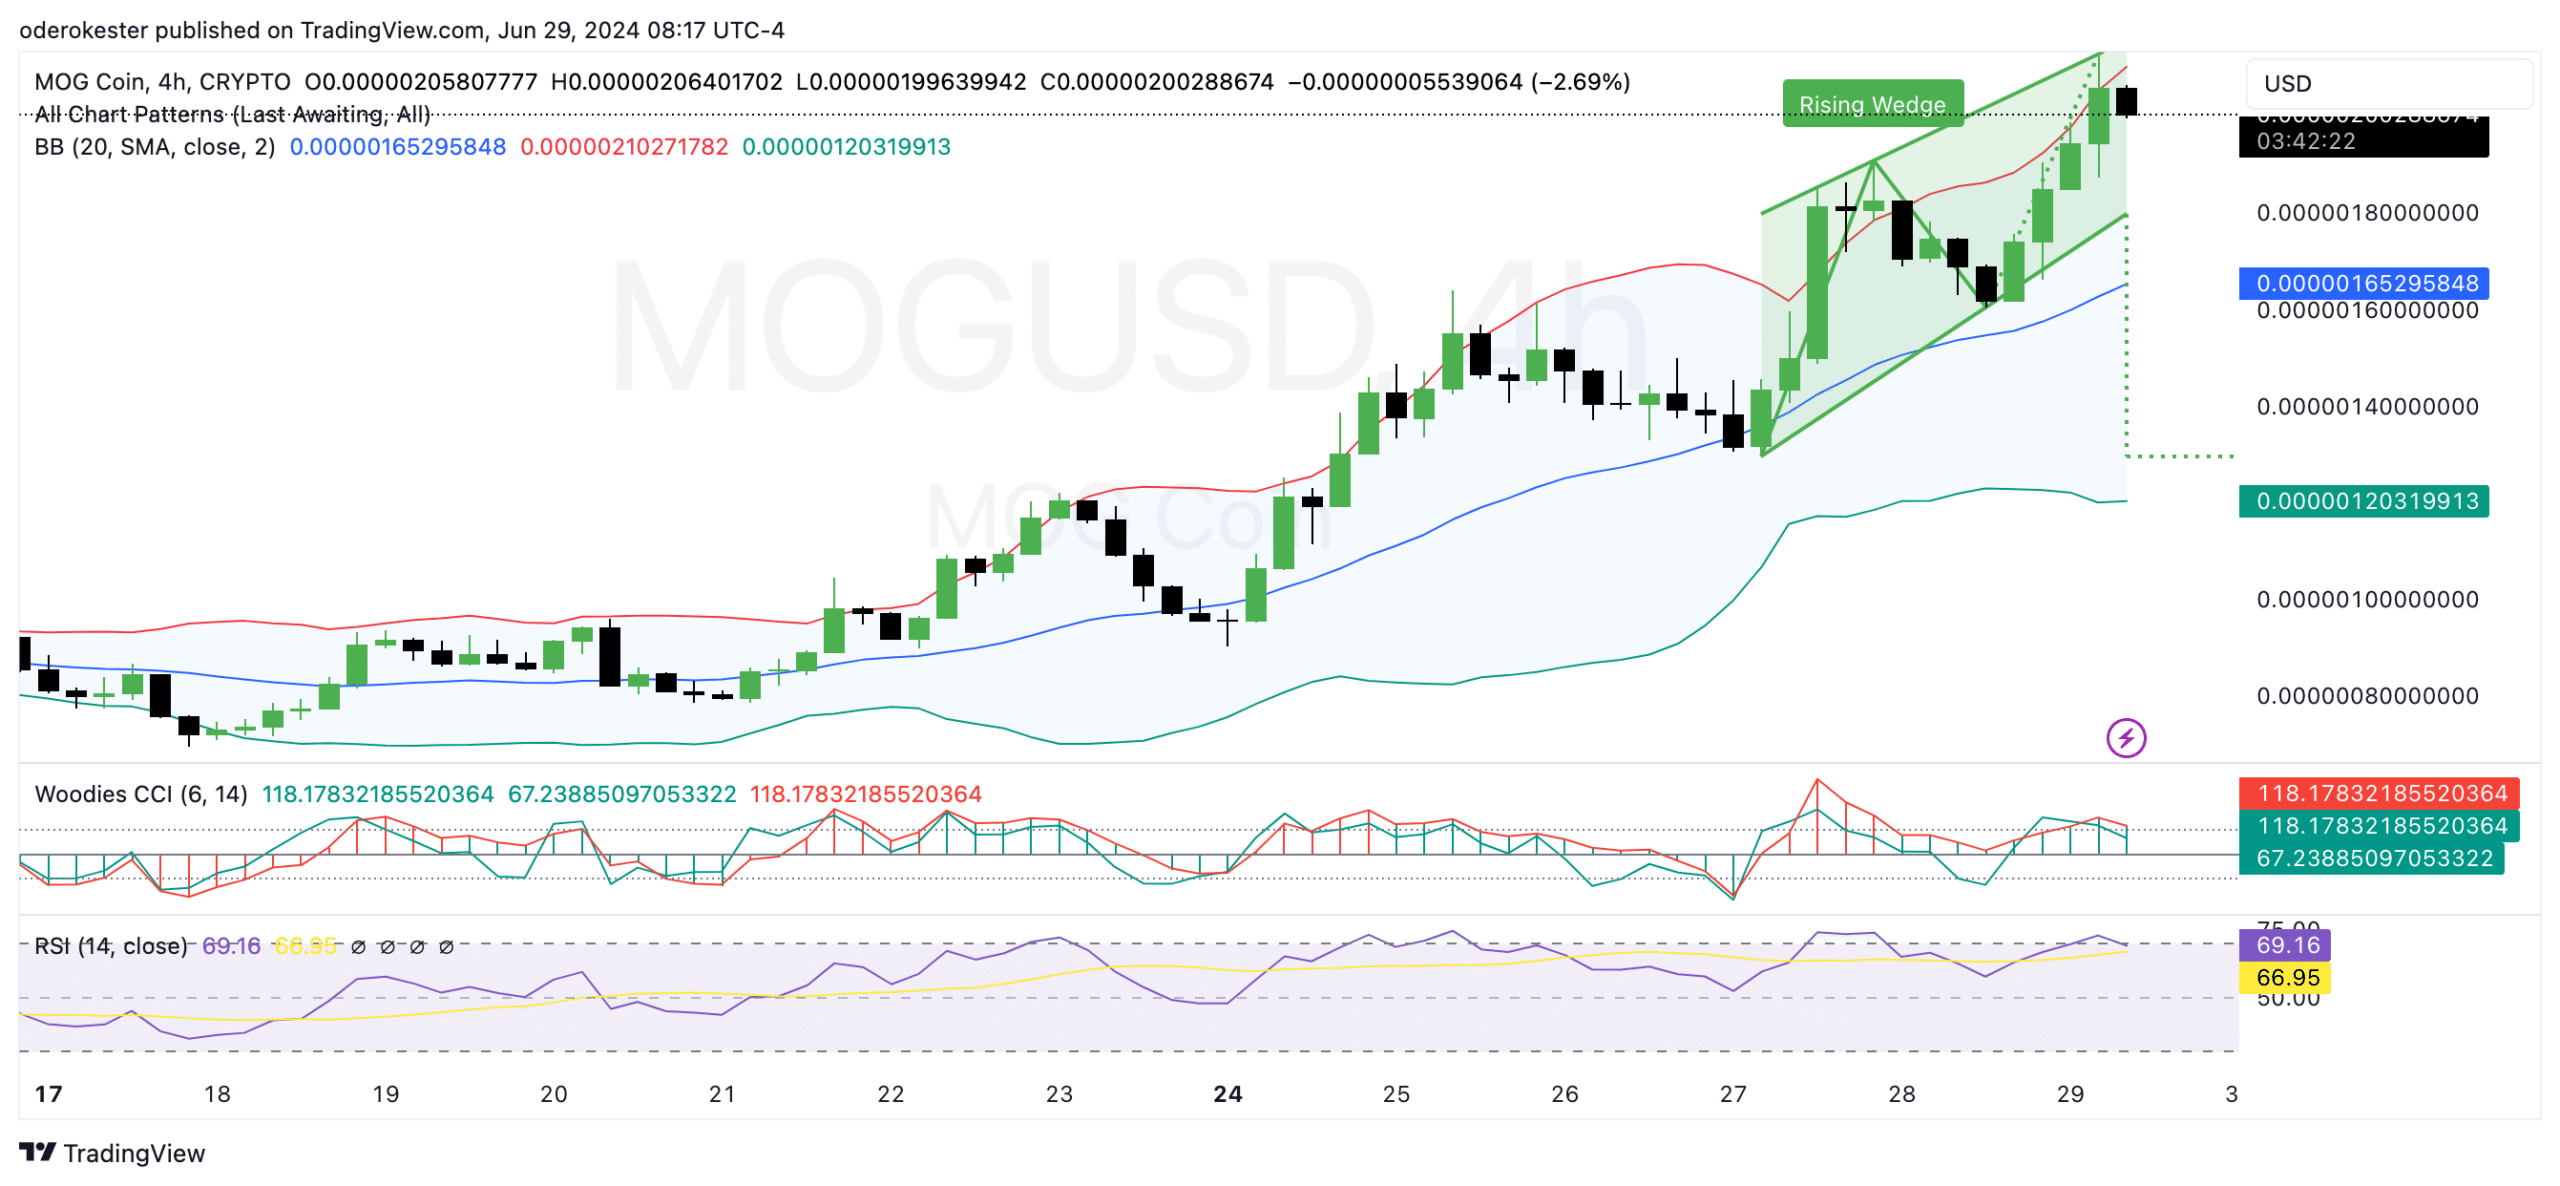
Source: TradingView
According to IntoTheBlock, transaction statistics for Mog Coin revealed an overall increase in both transaction volume and price from late February to early May 2024.
Read Mog Coin’s [MOG] Price Prediction 2024-25
The number of transactions peaked in late May, aligning with a price surge, before they began to decline in June.
This pattern indicated a period of heightened activity and interest in the Ethereum-based memecoin, followed by a subsequent decrease in market engagement.

Robert Johnson is a UK-based business writer specializing in finance and entrepreneurship. With an eye for market trends and a keen interest in the corporate world, he offers readers valuable insights into business developments.