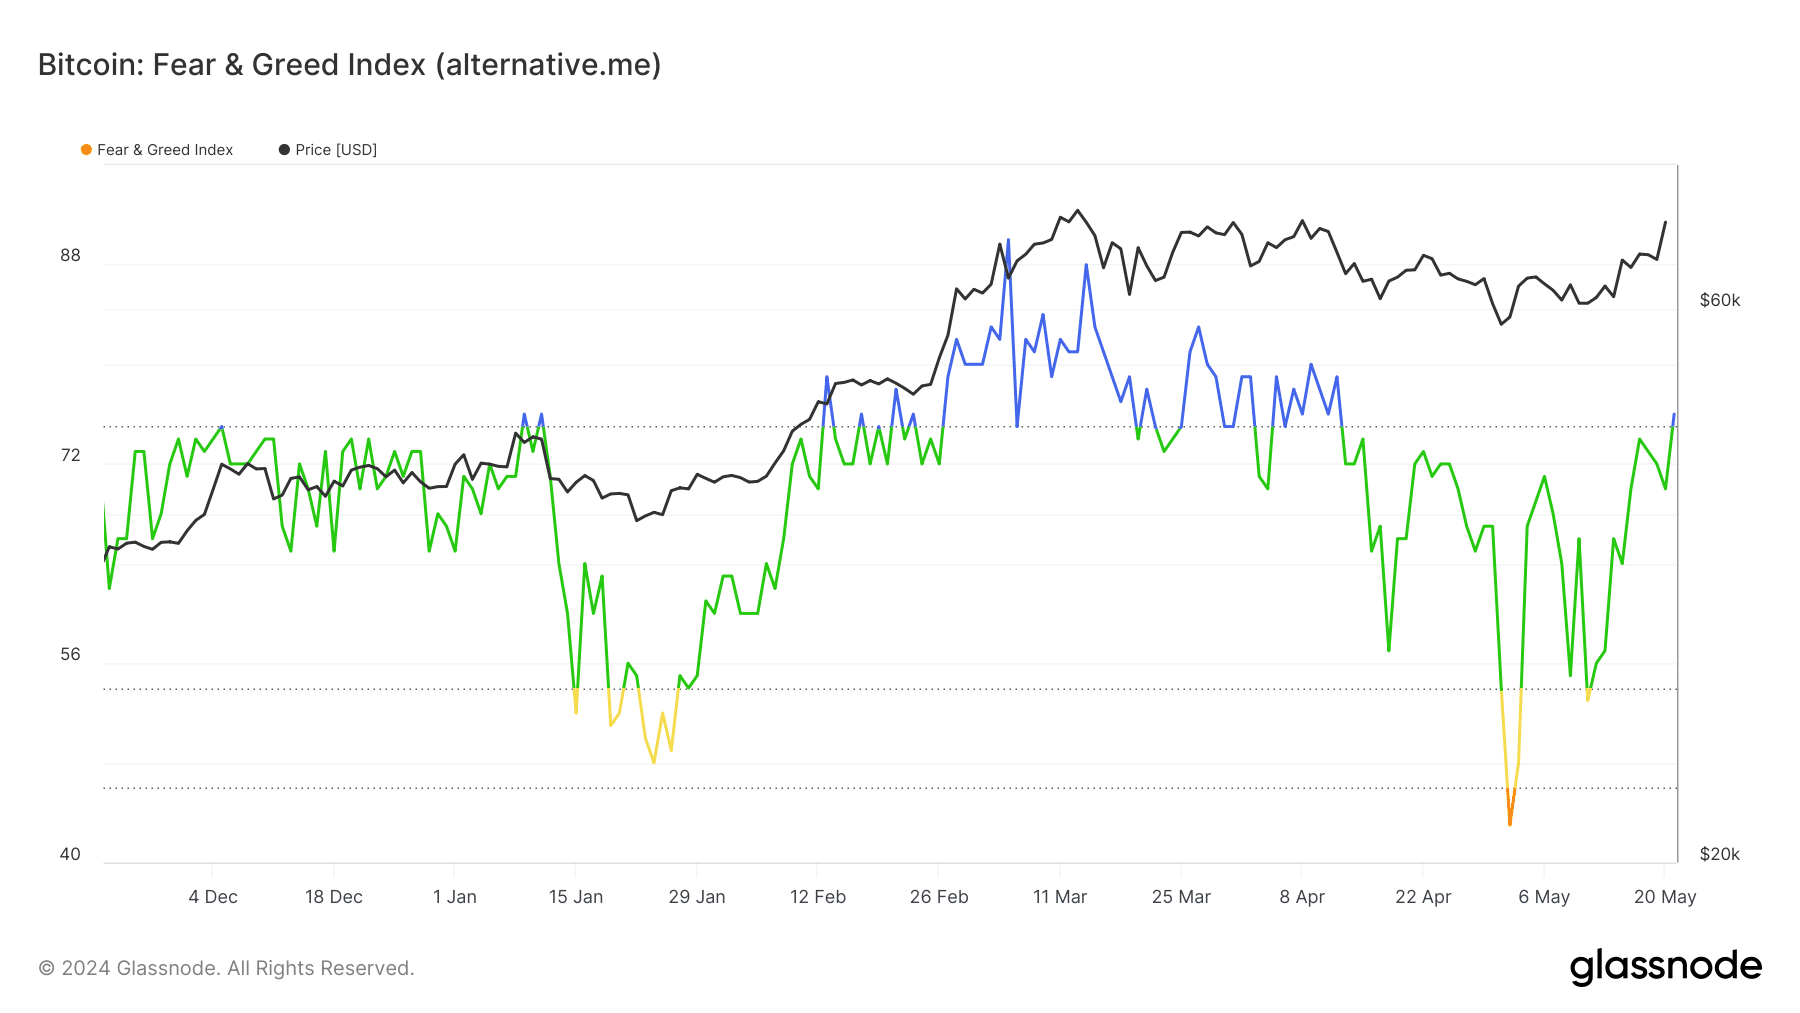
- Bitcoin price hit $71,000, leading the market to hit a fear and greed index of 76.
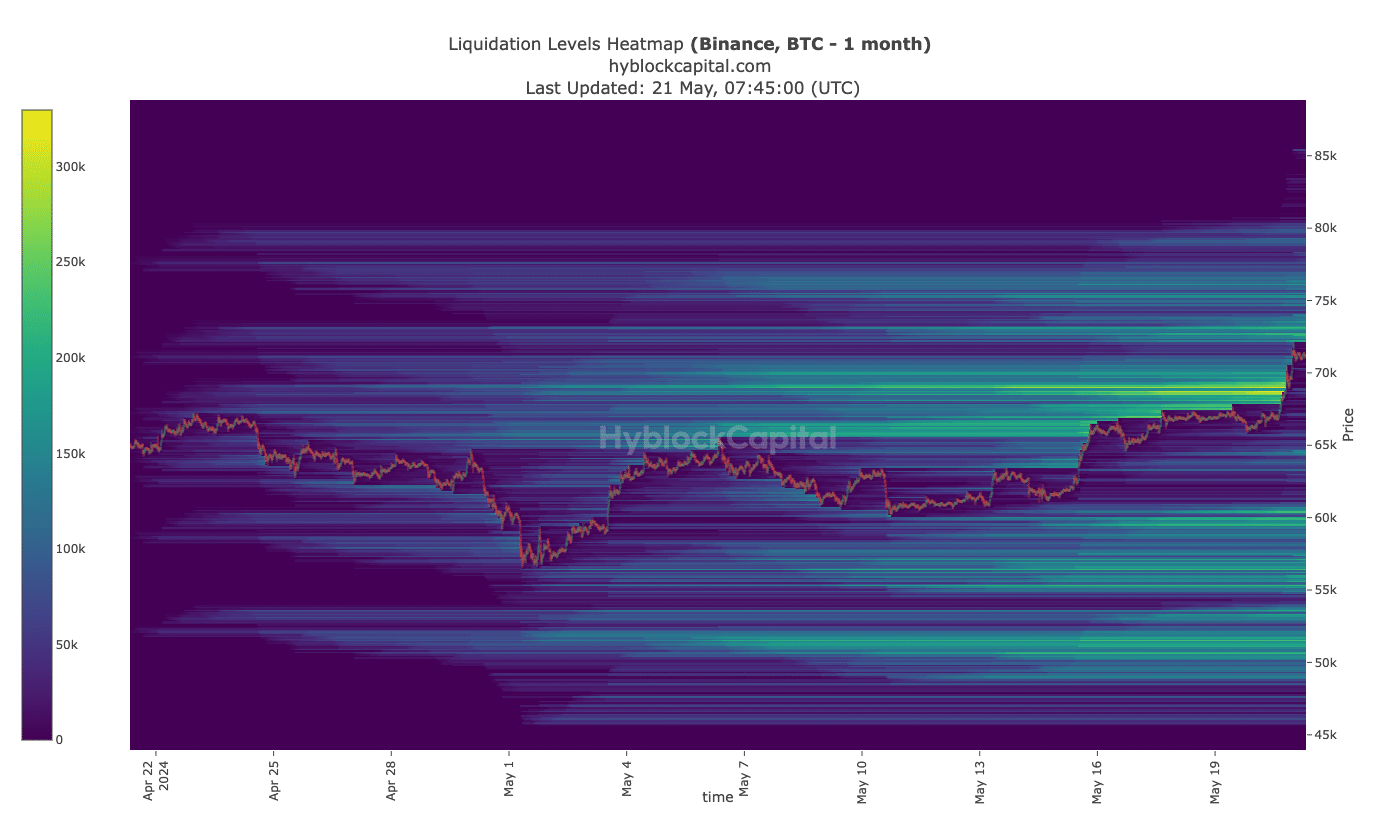
- The liquidation heatmap pinpointed $76.900 as the next target for BTC.
Bitcoin’s [BTC] price hit $71,000 for the first time in almost 40 days, bringing optimism back to the market. The price increase aligned with AMBCrypto’s recent analysis which explained how the bull run was not over.
Beyond the metrics mentioned in that article, there were other reasons BTC recovered. First on the register were the ETFs. For those unfamiliar, a Bitcoin ETF is not the same as BTC.
It, however, suggests that an investor has exposure to Bitcoin. As such, if the price of the cryptocurrency increases, then the ETF Net Asset Value (NAV), which represents the value of each share, would also increase.
The heavyweights are back
In the first quarter of 2024, billions of dollars flowed into Bitcoin ETFs, prompting the price to reach an all-time high before the halving. However, the issuers failed to attract the king of capital they once had during the first part of the second quarter.
As a result, BTC slumped, slipping below $59,00 at one point. However, that condition has changed for the better. As of the 20th of May, the total netflow into Bitcoin ETFs was $235 million.
This meant that ARK, BlackRock, Fidelity, and Grayscale had registered inflows for four straight days. If sustained, Bitcoin’s price could be in line to rise past $73,000 before the end of May.
Apart from this data, AMBCrypto looked at the fear and greed index. According to Glassnode, Bitcoin’s fear and greed index returned to 76— an 8.57% increase in the last 24 hours.

Source: Glassnode
This reading, represented by the color green, implies the market was in the greedy region. The last time BTC rallied to a new high, the metric hit 90— an extremely greedy (blue) region.
Liquidations pour in: What’s next for BTC?
As it stands, Bitcoin was not at a point where positive investor sentiment was exaggerated. With this position, the coin price might still appreciate, and rising close to $75,000 could be possible in a few days.
Furthermore, it is noteworthy to mention that $96.87 million worth of BTC contracts were liquidated in the last 24 hours. According to Coinglass, short liquidations accounted for almost $80 million while the rest were longs.


Source: Coinglass
For context, shorts are traders betting on the price of an asset to decrease. Longs, on the other hand, place bets on a price increase.
In addition, AMBCrypto analyzed the liquidation heatmap to check the next level for Bitcoin’s price to hit. Liquidation heatmap helps traders to identify areas of high liquidity.


Source: Hyblock
Is your portfolio green? Check the Bitcoin Profit Calculator
If liquidity is concentrated in a region, price might move toward the point while large liquidations can also occur. According to data from Hyblock, high liquidity existed from $73,300 and above.
Therefore, Bitcoin could squeeze past its all-time high, and a target of $76,900 could be the next peak it hits.

Robert Johnson is a UK-based business writer specializing in finance and entrepreneurship. With an eye for market trends and a keen interest in the corporate world, he offers readers valuable insights into business developments.


