
- Bitcoin’s price dropped by over 6% in the last seven days.
- A few metrics hinted at a market bottom, but indicators suggested otherwise.
Bitcoin [BTC] witnessed a considerable price correction last week, sparking fear among investors. But things might take a U-turn soon, as there were chances of a trend reversal. This seemed to be the case as BTC was mimicking its 2017 price trend.
Bitcoin’s historical trend
Investors didn’t make a profit last week as BTC’s chart remained red. According to CoinMarketCap, BTC was down by more than 6% in the last seven days, pushing its price once again under the $67k mark.
At the time of writing, BTC was trading at $66,896.42 with a market capitalization of over $1.32 trillion.
Meanwhile, Milkybull, a popular crypto analyst, recently posted a tweet highlighting an interesting development. As per the tweet, BTC was mimicking a trend that it followed back in 2017 before beginning a bull rally.
The tweet revealed that BTC’s price was about to reach a market bottom, after which, if history repeats itself, BTC’s price might kickstart a bull rally. Additionally, an indicator was also showing a bullish divergence, just like in 2017.
There was even more good news. AMBCrypto’s analysis of Glassnode’s data also revealed a bullish indicator.
According to BTC’s Pi Cycle Top indicator, Bitcoin’s price was resting at its market bottom, and if a trend reversal happens, then it might touch $89k soon.
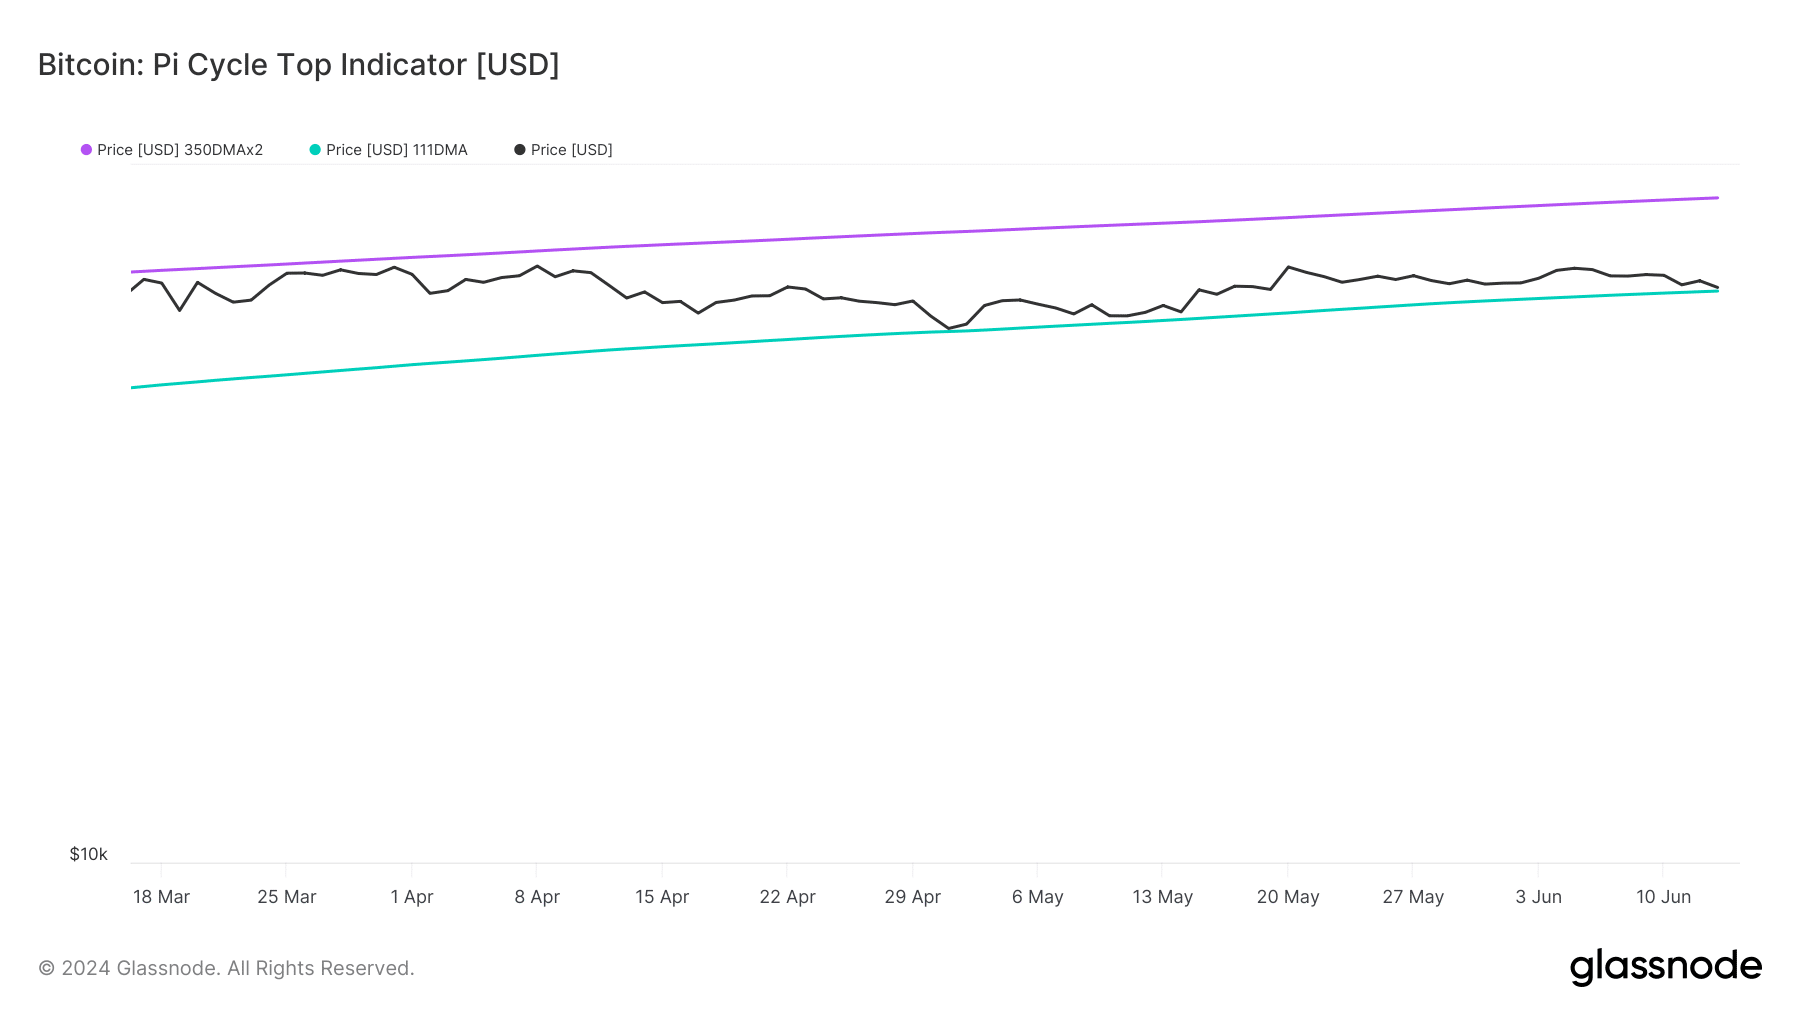
Source: Glassnode
Is BTC preparing for a rally?
AMBCrypto then checked CryptoQuant’s data to see whether metrics also hinted at a price increase. BTC’s exchange reserve was dropping, meaning that selling pressure on BTC was low.

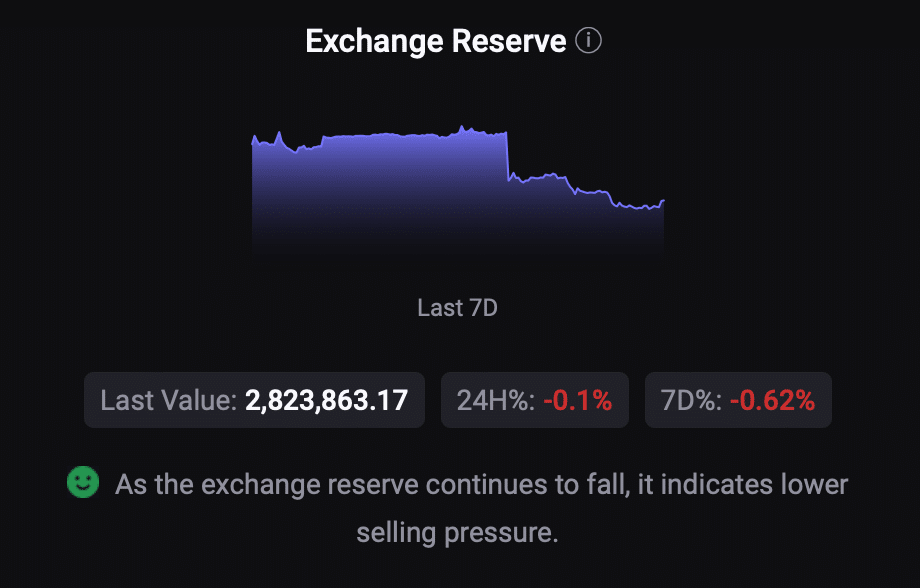
Source: CryptoQuant
Its Binary CDD was also green, meaning that long-term holders’ movements in the last seven days were lower than average. They have a motive to hold their coins. However, the rest of the metrics looked bearish.
For instance, BTC’s aSORP suggested that more investors are selling at a profit, which might cause further trouble for BTC’s already bearish price action.
On top of that, BTC’s fear and greed index had a value of 63% at press time, meaning that the market was in a “greed” phase. Whenever the metric reaches this level, it indicates that the chances of a price decline are high.
A few of the market indicators also looked pretty bearish. For example, its Chaikin Money Flow (CMF) had registered a sharp downtick.
Read Bitcoin’s [BTC] Price Prediction 2024-2025
Additionally, the Relative Strength Index (RSI) was also resting under the neutral mark, indicating a further price decline.
Nonetheless, the Money Flow Index (MFI) supported the bulls as it moved northwards from the neutral mark.

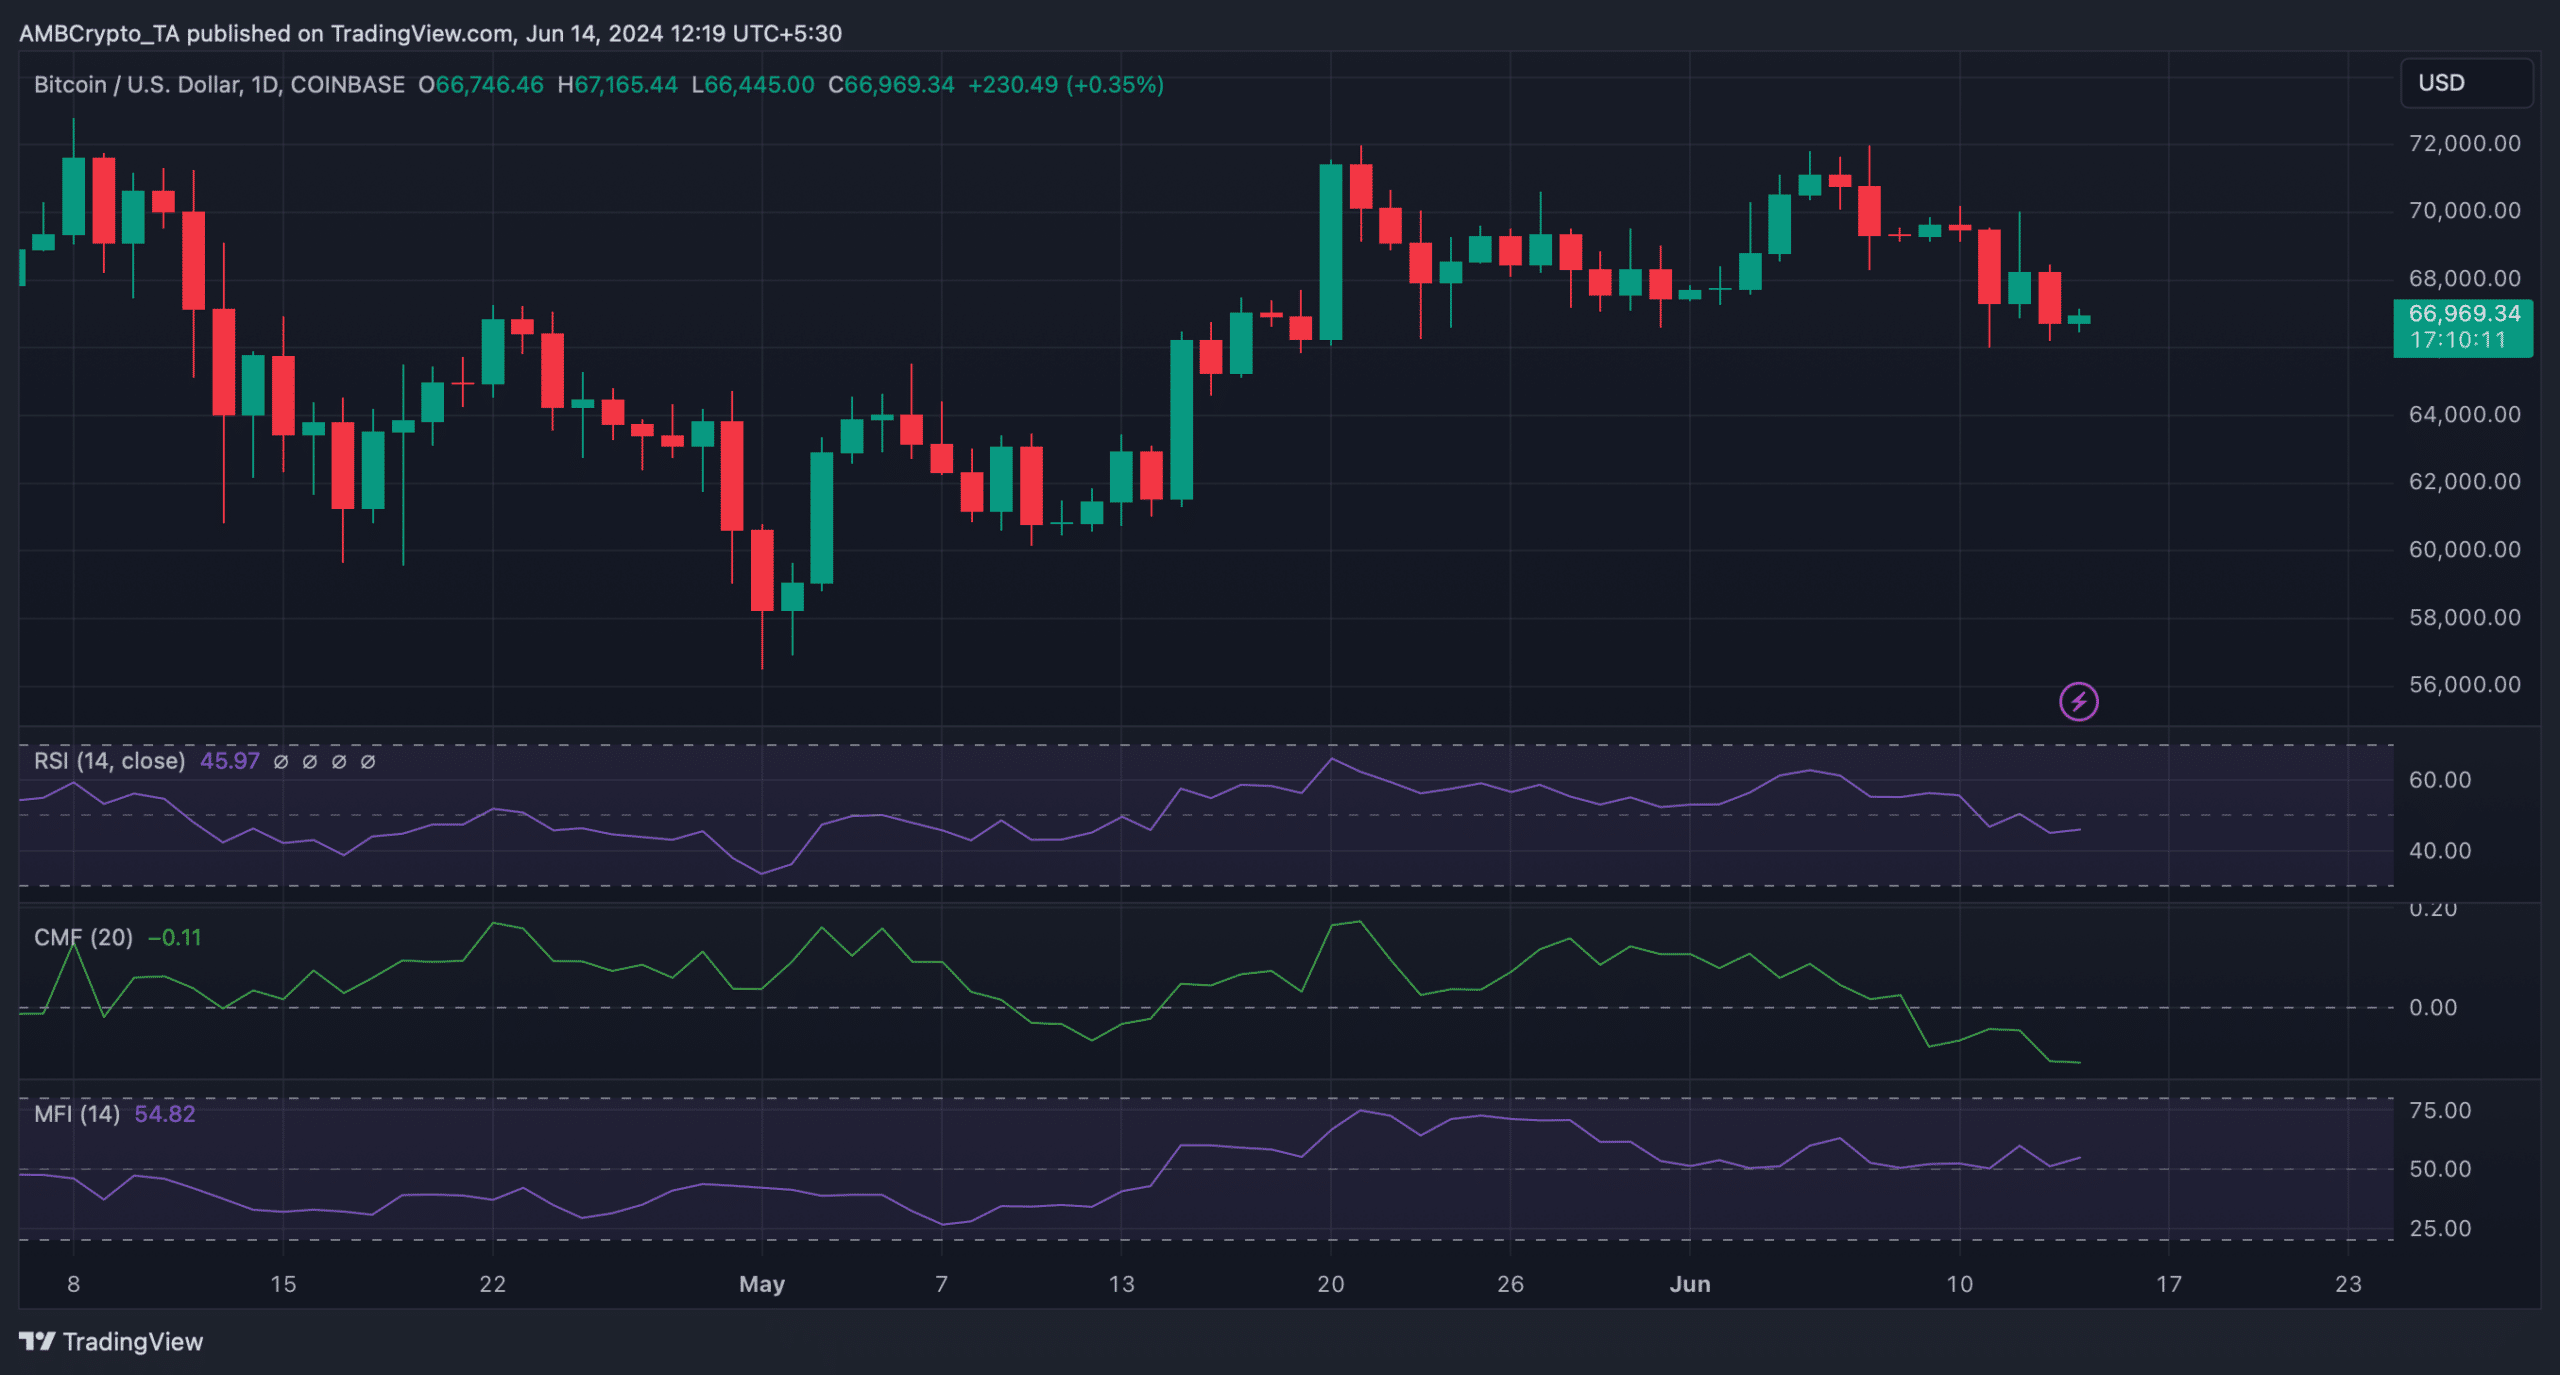
Source: TradingView

Robert Johnson is a UK-based business writer specializing in finance and entrepreneurship. With an eye for market trends and a keen interest in the corporate world, he offers readers valuable insights into business developments.