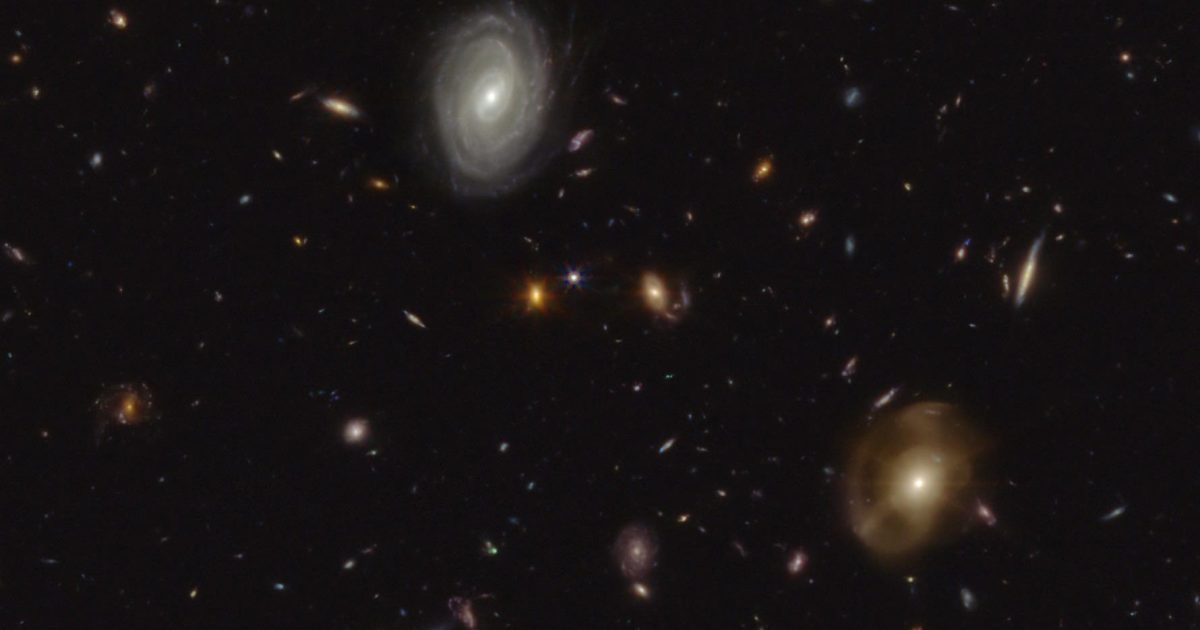
Since ancient times, humanity has studied the skies.
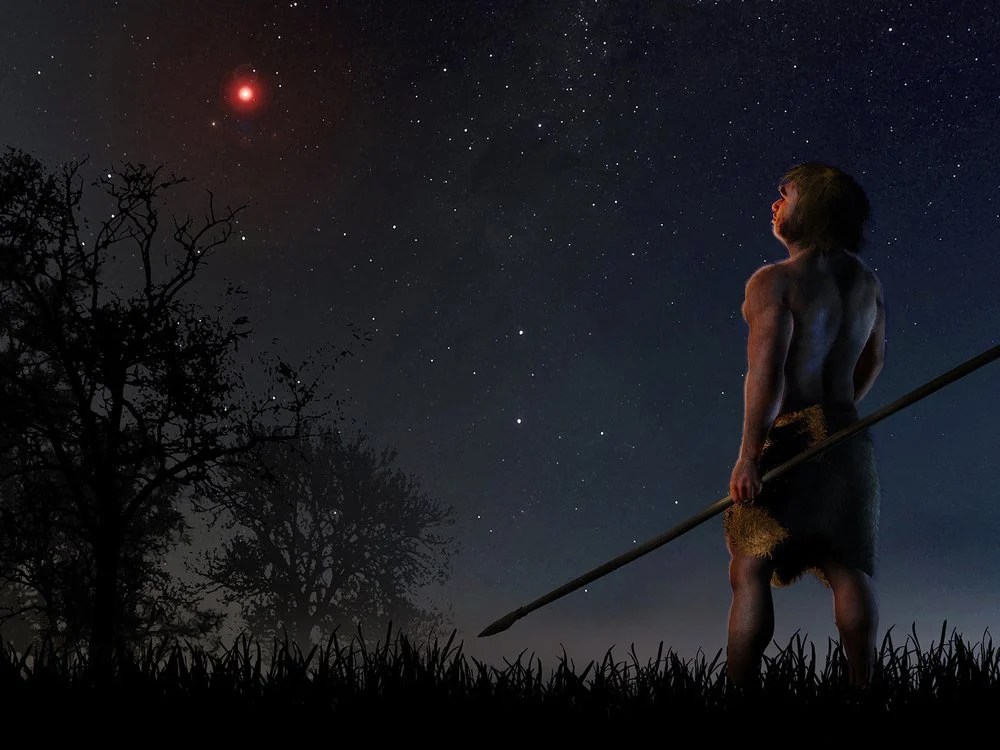

70,000 years ago, a red dwarf-brown dwarf pair known as Scholz’s star, so faint that it was only discovered very recently, passed through the Solar System’s Oort cloud. Unlike the illustration, however, it’s so intrinsically faint that it still wouldn’t have been visible to human eyes; today, it’s approximately 22 light-years away. Other stars, in the near future, will pass even closer, but it is a near-certainty that even our pre-human ancestors were watching and cataloging the night skies.
Cometary sightings, eclipses, and “temporary” stars date back thousands of years.
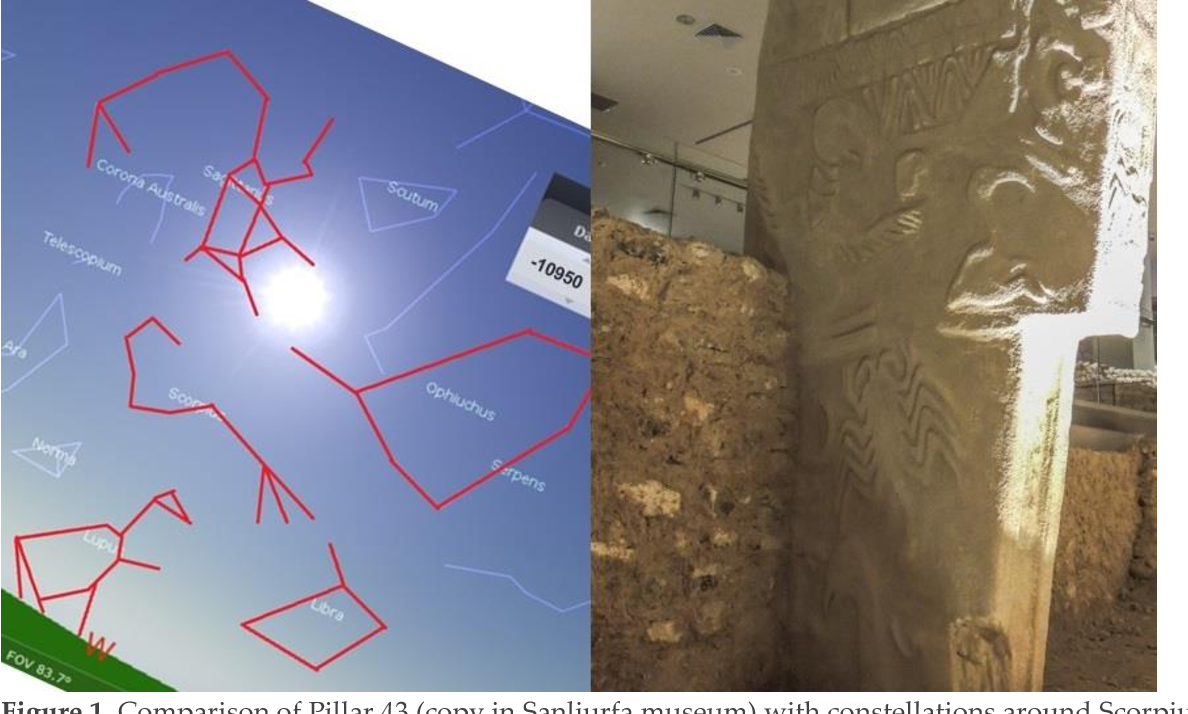

This particular image contrasts the constellations of the sky as they appeared thousands of years ago with corresponding artwork carved into stone at around the same time. Evidence that ancient peoples had an advanced knowledge of astronomy can be traced back as far as 38,000 years ago from cave paintings and other archaeological evidence.
Some ~2800 years ago, the Babylonians already predicted eclipses.


When the Moon passes directly between the Earth and the Sun, a solar eclipse occurs. Whether the eclipse is total or annular depends on whether the Moon’s angular diameter appears larger or smaller than the Sun’s as viewed from Earth’s surface. Only when the Moon’s angular diameter appears larger than the Sun’s are total solar eclipses possible, a situation that will no longer be possible about 600-650 million years from now. Eclipses have been predictable phenomena for nearly 3000 years: since the time of the ancient Babylonians.
By the 3rd Century BCE, Eratosthenes measured a spherical Earth’s circumference.


If the Earth were perfectly flat, then the Sun’s rays would cast identical shadows at noon on the solstice everywhere on Earth (top), no matter where you were located. But if the Earth’s surface were curved (bottom), shadows at different locations would cast different shadows on the same day, depending on the angle that the Sun’s rays struck the object in question. By measuring the difference in shadow angle between two points on Earth’s surface, it became possible to not only determine Earth’s spherical (or spheroidal) nature, but to measure the size of the Earth for the first time.
Shortly thereafter, Aristarchus estimated the Moon’s size and distance.


Animation showing the umbral phase of the November 19, 2021 partial lunar eclipse. At 9:03 AM UT, maximum eclipse is reached, where only 0.9% of the Moon remains illuminated by direct sunlight. The umbral phase lasts over 3.5 hours: the longest this century for a partial eclipse. Reconstructing the size of Earth’s shadow relative to the physical size of the Moon is the oldest method for measuring both the size of the Moon as well as the distance to it: a method first leveraged by Aristarchus back in the 3rd Century BCE.
But making sense of the Universe took much longer.


Artist’s logarithmic scale conception of the observable universe. The Solar System gives way to the Milky Way, which gives way to nearby galaxies which then give way to the large-scale structure and the hot, dense plasma of the Big Bang at the outskirts. Each line-of-sight that we can observe contains all of these epochs, but the quest for the most distant observed object will not be complete until we’ve mapped out the entire Universe.
Planetary motion — in ellipses around the Sun — wasn’t known until Kepler’s 1609 discovery.
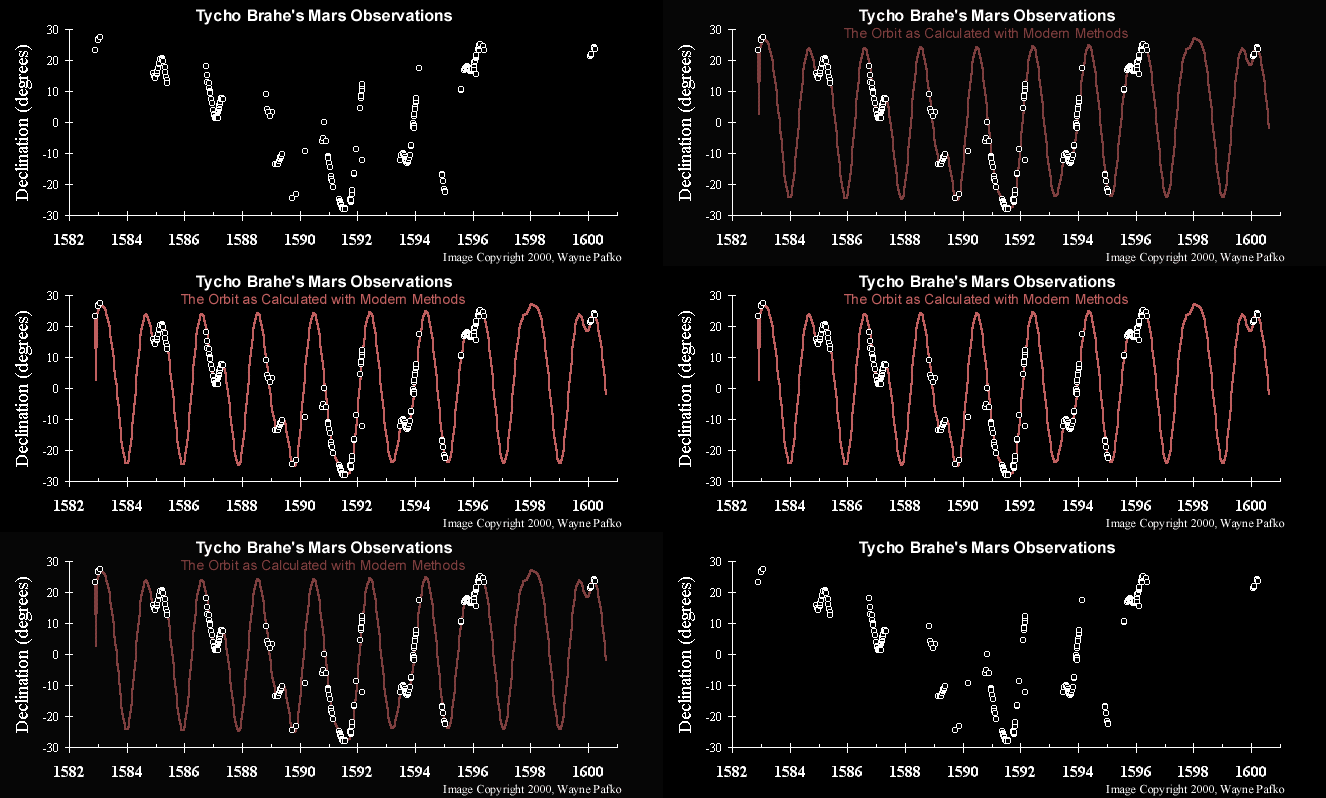

Tycho Brahe conducted some of the best observations of Mars prior to the invention of the telescope, and Kepler’s work largely leveraged that data. Here, Brahe’s observations of Mars’s orbit, particularly during retrograde episodes, provided an exquisite confirmation of Kepler’s elliptical orbit theory. Kepler put forth his 1st and 2nd laws of planetary motion in 1609, with his 3rd law coming 10 years later: in 1619.
The recurrence of comets wasn’t understood until Edmond Halley: in 1705.


This comet, imaged in 2015 and known as C/2014 Q2 Lovejoy, brightened sufficiently to become as bright as magnitude +4: visible to the naked human eye even under fairly light-polluted conditions. Comet Swift-Tuttle, when it next returns, will be about 20 times brighter, and is far more massive and dangerous. Although comets have been recorded for thousands of years, their periodic nature was only uncovered in the 18th century, by Edmond Halley.
Our Solar System’s 7th and 8th planets weren’t known until 1781 and 1846, respectively.


Voyager 2 flew by both Uranus (right, discovered in 1781) and Neptune (left, discovered in 1846), and revealed the properties, colors, atmospheres, and ring systems of both worlds. They both have rings, many interesting moons, and atmospheric and surface phenomena awaiting investigation. The biggest unknown difference between the two worlds is why Neptune appears to generate its own heat while Uranus does not.
The first direct distance determination for a nighttime star wasn’t published until 1838.


61 Cygni was the first star to have its parallax measured and published (back in 1838), but also is a difficult case due to its large proper motion. These two images, stacked in red and blue and taken almost exactly one year apart, show this binary star system’s fantastic speed. If you want to measure the parallax of an object to extreme accuracy, you’ll make your two ‘binocular’ measurements simultaneously, to avoid the effect of the star’s motion through the galaxy. Gaia is exceptionally good at characterizing the orbits of nearby stars with small separations from their companion, but faces more challenges with more distant, wider binary systems.
We didn’t know cometary debris streams caused meteor showers until 1866.


This map shows the debris stream of Comet Encke, a short-period comet in orbit around the Sun and the parent of the Taurid meteor shower. The white area indicates where the debris stream is densest and corresponds to the comet’s nucleus, but debris has been stretched out and extended all across the entirety of the comet’s orbit. The connection between a comet’s debris stream and meteor showers on Earth was established by John Couch Adams in 1866.
Our modern laws of gravity only arrived in 1915.


A mural of the Einstein field equations, with an illustration of light bending around the eclipsed sun, the observations that first validated general relativity four years after it was first theoretically put forth: back in 1919. The Einstein tensor is shown decomposed, at left, into the Ricci tensor and Ricci scalar, with the cosmological constant term added in after that. Novel tests of new theories, particularly against the differing predictions of the previously prevailing theory, are essential tools in scientifically testing an idea.
The first measured galactic distances only arrived in 1923.
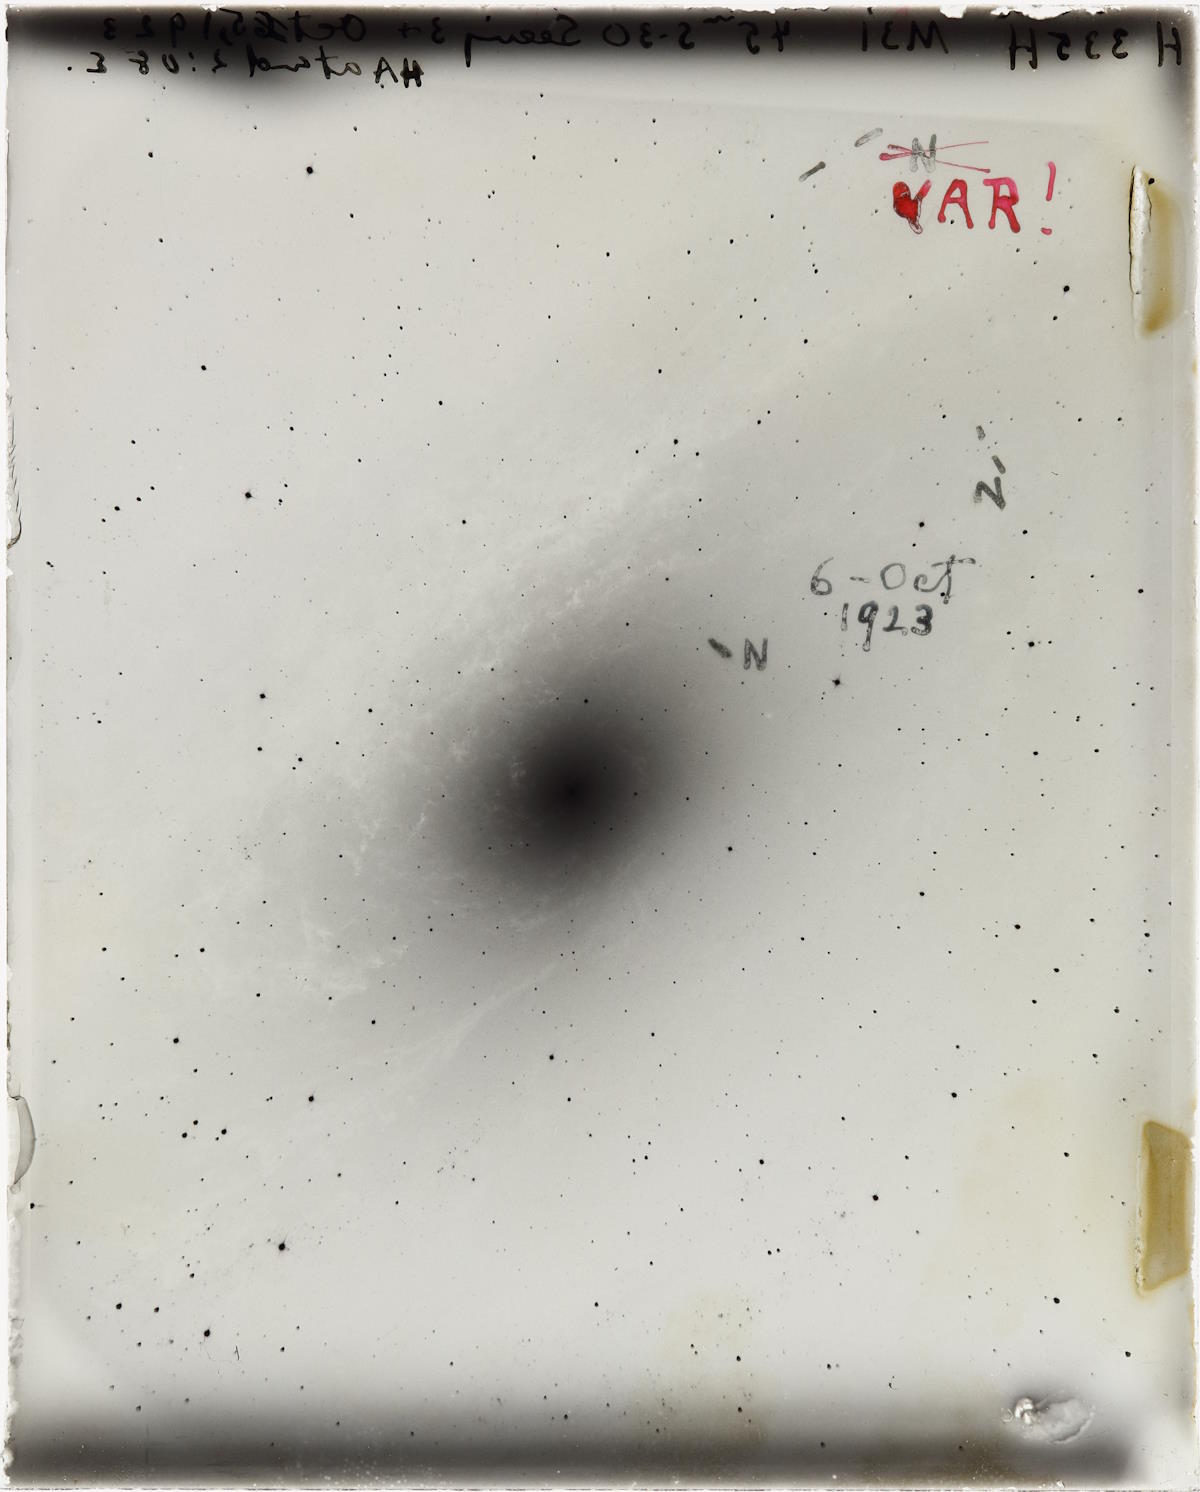

Perhaps the most famous photographic plate in all of history, this image from October of 1923 features the great nebula (now galaxy) in Andromeda along with the three novae that Hubble observed within them. When a fourth brightening event happened in the same location as the first, Hubble recognized this was no nova, but a Cepheid variable star. The “VAR!” written in red pen was Hubble having a spectacular realization: this meant Andromeda was an extragalactic object, located far beyond the Milky Way.
The expansion of the Universe was only determined from 1927-1929.


Edwin Hubble’s original plot of galaxy distances, from 1929, versus redshift (left), establishing the expanding Universe, versus a more modern counterpart from approximately 70 years later (right). Many different classes of objects and measurements are used to determine the relationship between distance to an object and its apparent speed of recession that we infer from its light’s relative redshift with respect to us. As you can see, from the very nearby Universe (lower left) to distant locations over a billion light-years away (upper right), this very consistent redshift-distance relation continues to hold. Earlier versions of Hubble’s graph were composed by Georges Lemaître (1927) and Howard Robertson (1928), using Hubble’s preliminary data.
The first evidence for dark matter arrived in 1933, with more compelling evidence arriving in the 1970s.
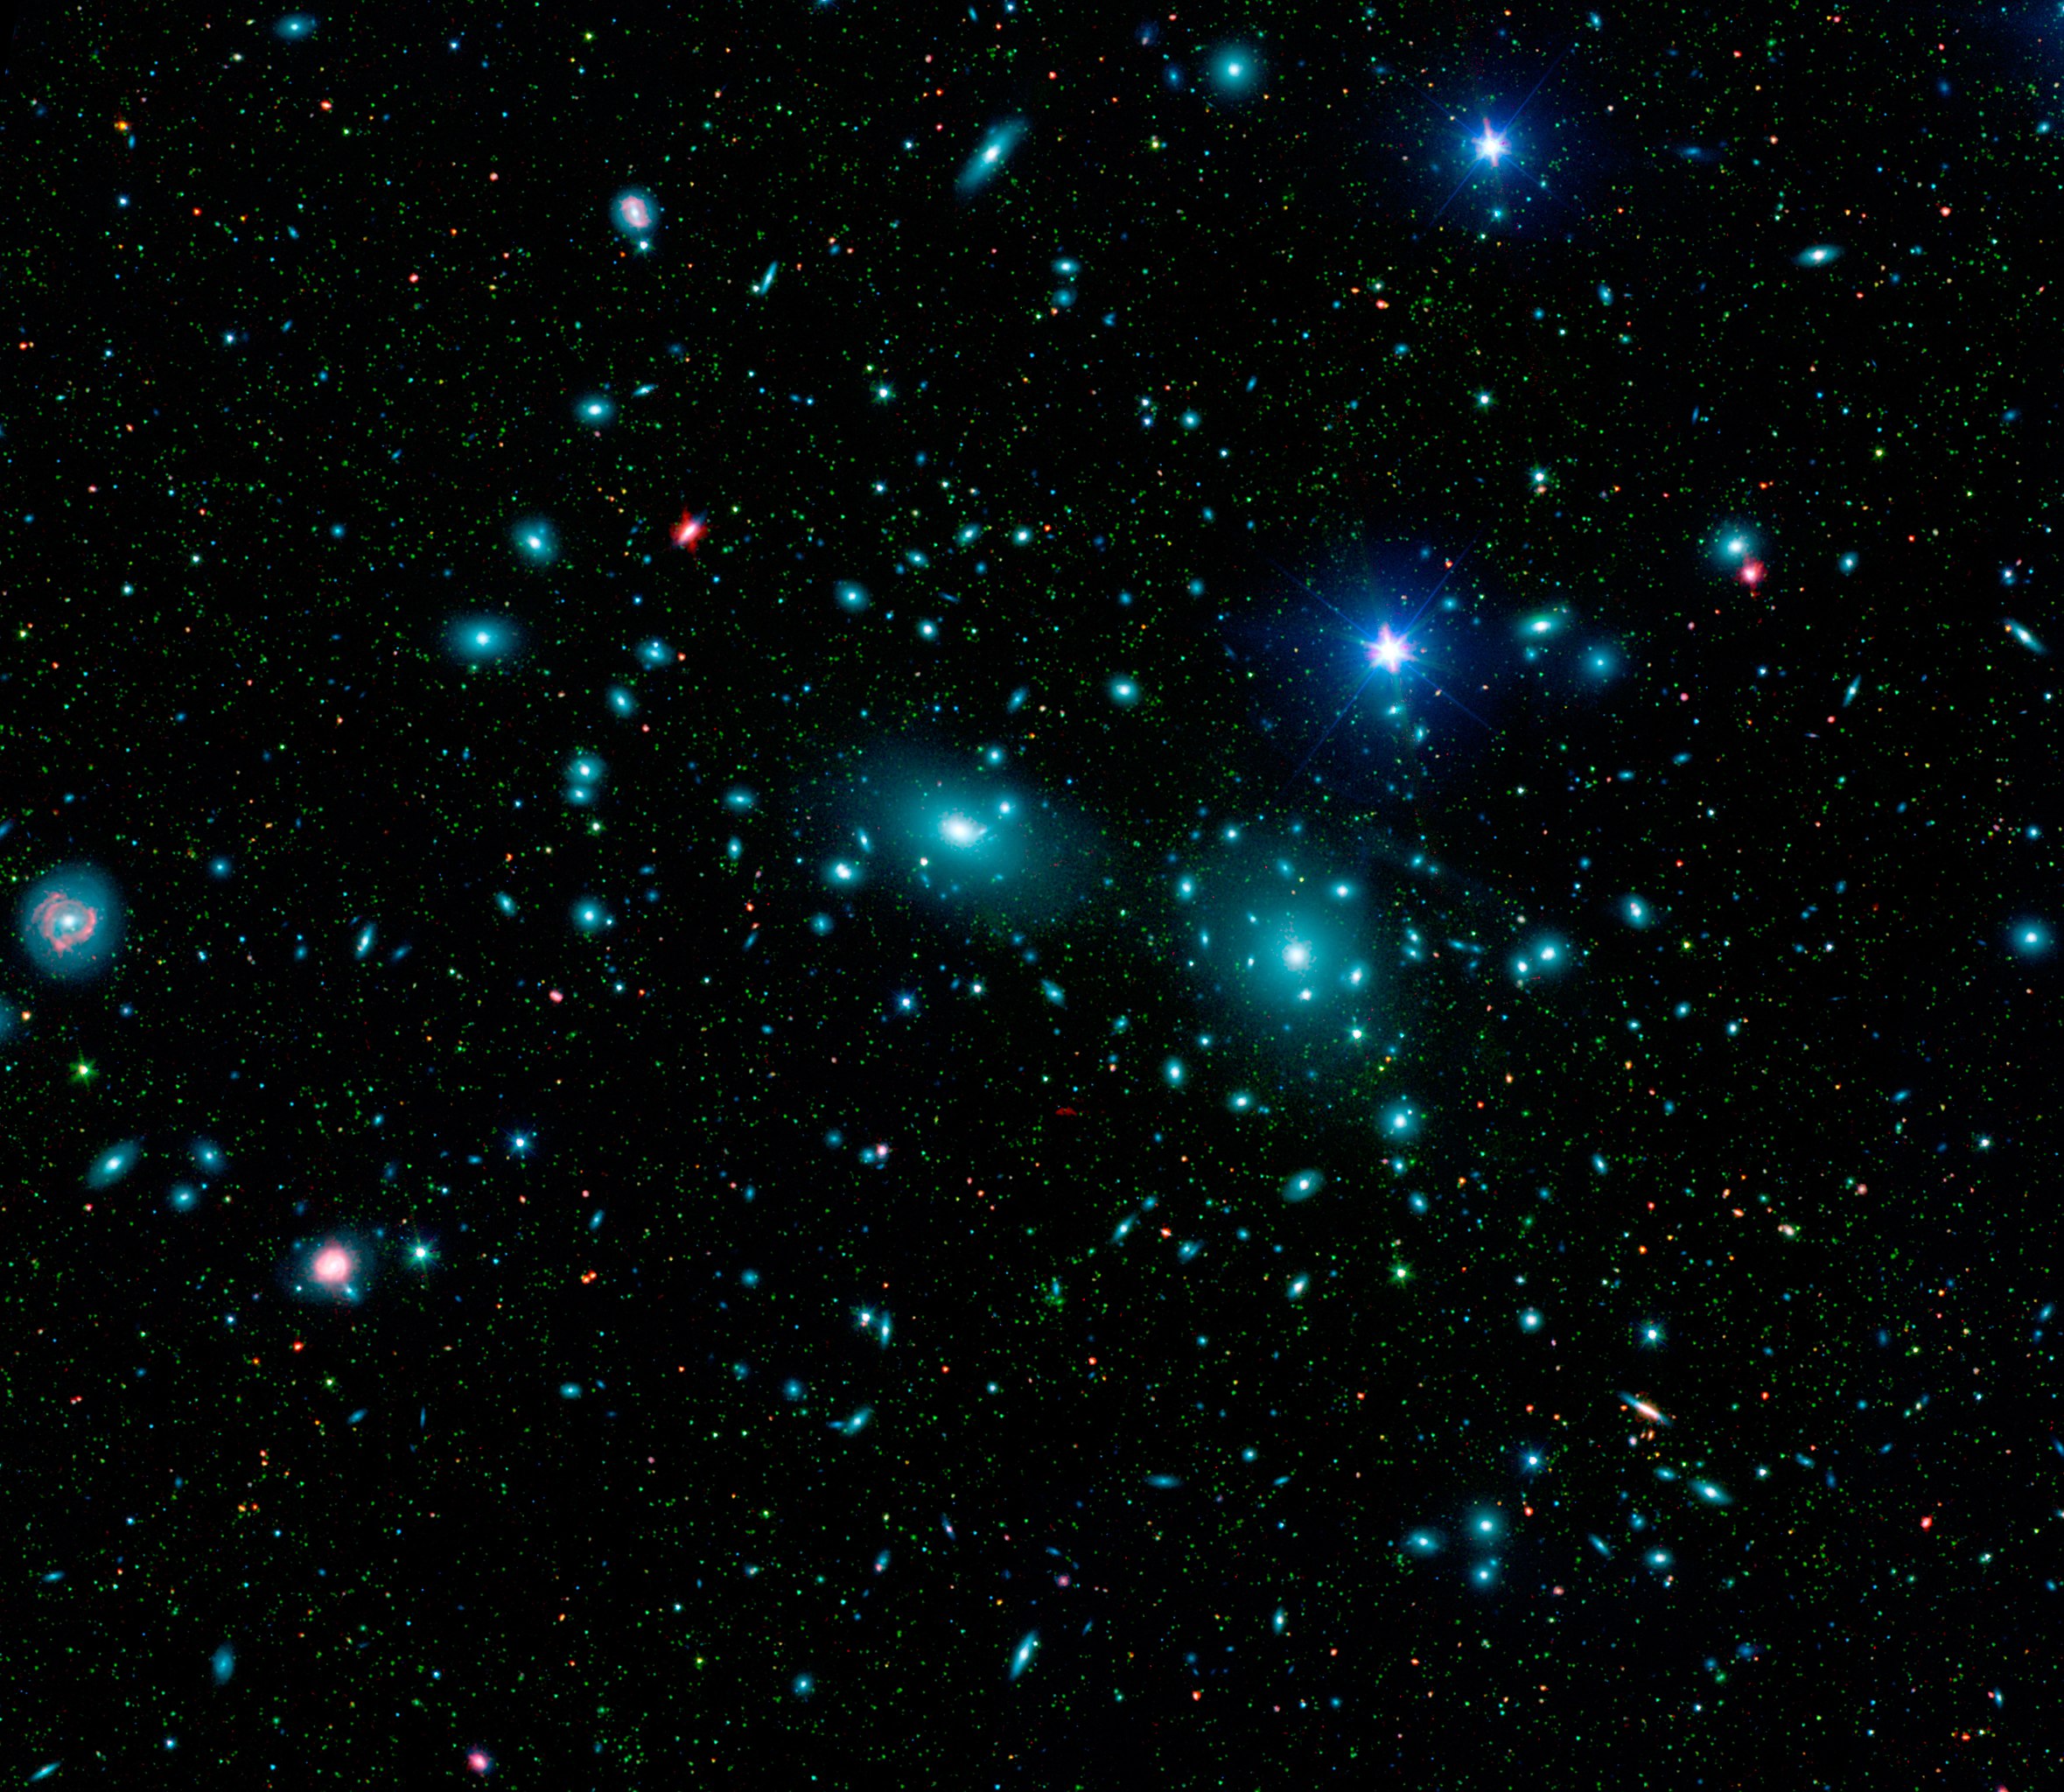

The Coma Cluster of galaxies, as seen with a composite of modern space and ground-based telescopes. The infrared data comes from the Spitzer Space telescope, while ground-based data comes from the Sloan Digital Sky Survey. The Coma Cluster is dominated by two giant elliptical galaxies, with over 1000 other spirals and ellipticals inside. By measuring how quickly these galaxies move around inside the cluster, we can infer the cluster’s total mass; it’s many times greater than not only stars, but all forms of normal matter, combined, can explain. Very massive clusters, many thousands of times the Milky Way’s mass, are common in the modern universe, but very rare early on.
The Big Bang was observationally confirmed in 1964.
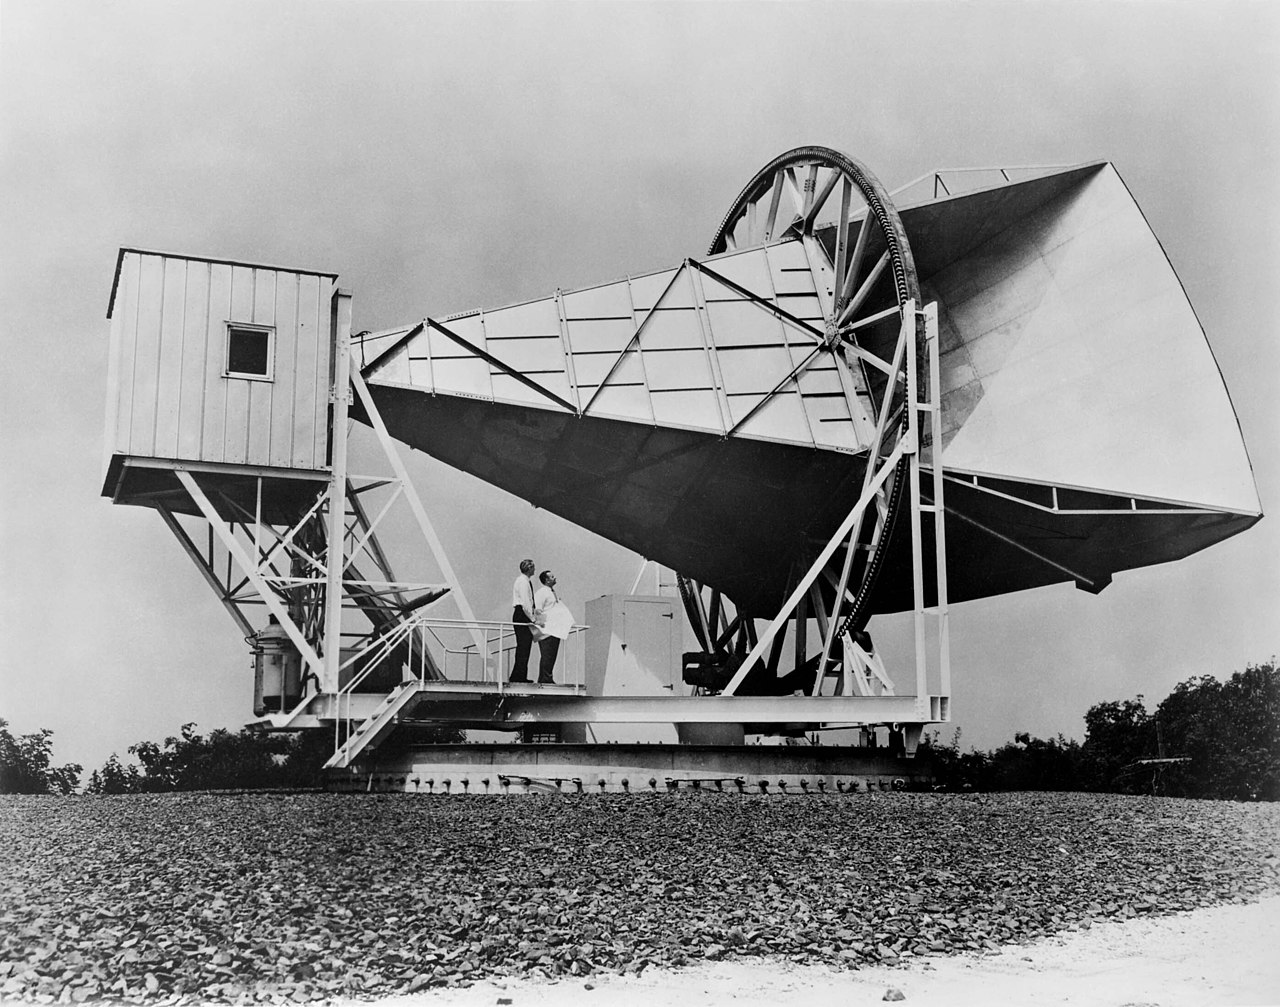

This image shows Arno Penzias and Robert Wilson, co-discoverers of the Cosmic Microwave Background, with the Holmdel Horn Antenna used to discover it. Their completely serendipitous discovery has been interpreted as the strongest evidence for the Big Bang origin of our Universe, with other sources of low-energy radiation unable to explain the CMB’s observational properties.
Dark energy’s presence was first uncovered in 1998.


This graph shows the 1550 supernovae that are a part of the Pantheon+ analysis, plotted as a function of magnitude versus redshift. The supernova data, for many decades now (ever since 1998), has pointed toward a Universe that expands in a particular fashion that requires something beyond matter, radiation, and/or spatial curvature: a new form of energy that drives the expansion, known as dark energy. The supernovae all fall along the line that our standard cosmological model predicts, with even the highest-redshift, most far-flung type Ia supernovae adhering to this simple relation.
Inflation’s observational signals, preceding the Big Bang, arrived in 2003.


This 2003 WMAP publication is the very first scientific paper to show the evidence for super-horizon fluctuations in the temperature-polarization correlation (TE cross-correlation) spectrum. The fact that the solid curve (and the data), and not the dotted line, is followed to the left of the annotated green dotted line is very difficult to overlook, and represents extremely strong evidence for super-horizon fluctuations: evidence for inflation.
New discoveries continually refine our growing cosmic understanding.
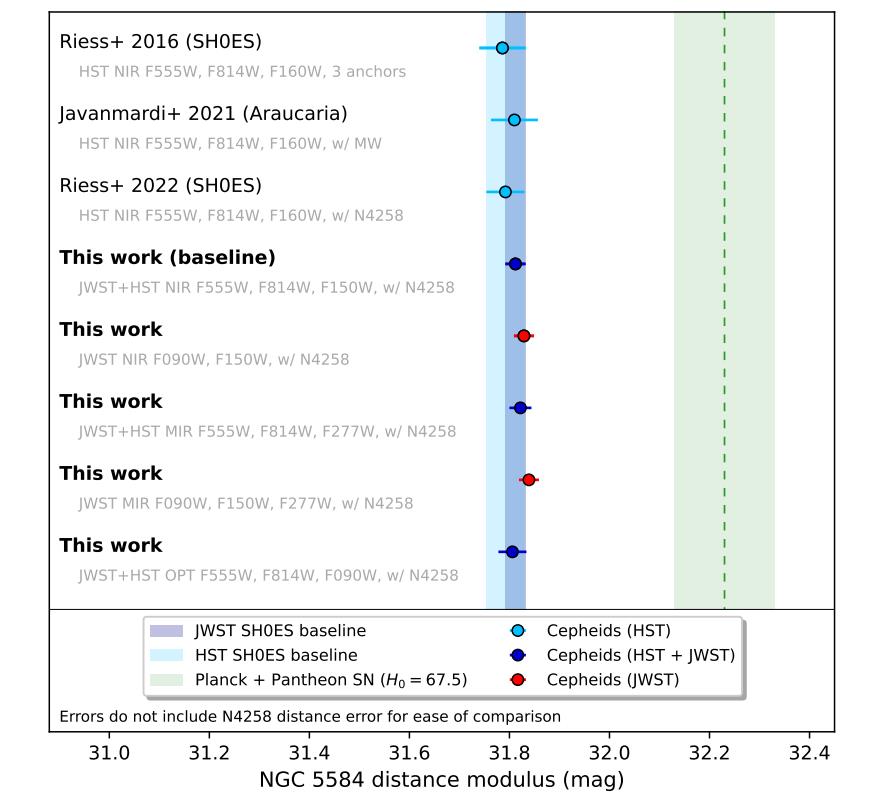

By enabling a better understanding of Cepheid variables in nearby galaxies NGC 4258 and NGC 5584, JWST has reduced the uncertainties in their distances even further. The lowest points on the graph show the estimate for the distance to NGC 5584 from the expansion rates inferred from the distance ladder (left side) and what’s expected from the early relic method (right side). The mismatch is significant and compelling.
Mostly Mute Monday tells an astronomical story in images, visuals, and no more than 200 words.

Dr. Thomas Hughes is a UK-based scientist and science communicator who makes complex topics accessible to readers. His articles explore breakthroughs in various scientific disciplines, from space exploration to cutting-edge research.

